3  Beyond the Burn – regionals, media, and volunteering

3.1 Regionals

3.1.1 Attended any regional Burning Man events/mixers/gatherings

2013 2014 2015 2016 2017 2018 2019 2022 2023
Volunteered with a regional 12.4% (11.7%, 13.0%) 14.4% (13.7%, 15.2%) 11.9% (11.3%, 12.6%) 11.0% (10.3%, 11.8%) 13.6% (12.9%, 14.3%) 13.6% (12.8%, 14.3%) 14.5% (13.7%, 15.4%) 14.3% (13.5%, 15.1%) 11.1% (10.3%, 12.0%)
Attended at least one regional 35.2% (34.3%, 36.2%) 36.9% (36.0%, 37.9%) 32.9% (31.9%, 33.9%) 32.3% (31.1%, 33.6%) 29.8% (28.8%, 30.8%) 31.5% (30.4%, 32.6%) 32.1% (31.0%, 33.2%) 32.4% (31.3%, 33.5%) 25.4% (24.2%, 26.7%)
Not attended, on e-mail list 16.9% (16.1%, 17.6%) 16.4% (15.7%, 17.2%) 19.8% (18.9%, 20.7%) 18.2% (17.1%, 19.2%) 17.4% (16.5%, 18.3%) 18.0% (17.1%, 18.9%) 18.6% (17.7%, 19.5%) 14.5% (13.7%, 15.4%) 14.8% (13.8%, 15.9%)
Not connected to regional 35.6% (34.6%, 36.5%) 32.2% (31.3%, 33.1%) 35.4% (34.4%, 36.5%) 38.5% (37.2%, 39.9%) 39.3% (38.2%, 40.4%) 37.0% (35.8%, 38.1%) 34.8% (33.7%, 35.9%) 38.8% (37.6%, 40.0%) 48.6% (47.1%, 50.1%)

3.1.2 Involvement with a regional Burning Man event

2015 2016 2017 2018 2019 2022 2023
Production 6.1% (5.6%, 6.6%) 5.6% (5.1%, 6.2%) 6.8% (6.3%, 7.4%) 6.5% (6.0%, 7.1%) 5.4% (4.9%, 6.0%) 5.5% (5.0%, 6.0%) 4.0% (3.5%, 4.5%)
Staff/volunteer -- -- -- -- 11.0% (10.4%, 11.8%) 11.0% (10.3%, 11.7%) 8.8% (8.1%, 9.6%)
Medical services -- -- -- -- 0.9% (0.7%, 1.1%) 0.9% (0.7%, 1.1%) 0.7% (0.5%, 1.0%)
Art project 5.0% (4.6%, 5.5%) 4.0% (3.5%, 4.4%) 5.2% (4.8%, 5.7%) 5.3% (4.8%, 5.8%) 5.2% (4.7%, 5.8%) 5.7% (5.2%, 6.3%) 3.6% (3.2%, 4.1%)
Theme camp 6.5% (6.0%, 7.0%) 5.9% (5.3%, 6.5%) 7.7% (7.1%, 8.2%) 7.6% (7.1%, 8.2%) 8.2% (7.6%, 8.9%) 7.9% (7.3%, 8.5%) 6.3% (5.7%, 7.0%)
Vendor 0.1% (0.1%, 0.2%) 0.3% (0.2%, 0.4%) 0.2% (0.1%, 0.3%) 0.2% (0.1%, 0.3%) 0.1% (0.1%, 0.3%) < 0.1% (--, --) < 0.1% (--, --)
Performance 2.9% (2.6%, 3.3%) 2.4% (2.1%, 2.9%) 3.1% (2.8%, 3.5%) 2.7% (2.4%, 3.1%) 2.4% (2.1%, 2.8%) 2.6% (2.3%, 3.0%) 2.2% (1.8%, 2.6%)
Other 3.4% (3.0%, 3.8%) 4.0% (3.5%, 4.6%) 5.0% (4.5%, 5.4%) 4.4% (4.0%, 4.9%) 1.1% (0.9%, 1.4%) 0.8% (0.6%, 1.0%) 0.6% (0.5%, 0.9%)
Not involved 88.1% (87.4%, 88.8%) 89.0% (88.2%, 89.7%) 86.4% (85.7%, 87.2%) 86.4% (85.7%, 87.2%) 85.5% (84.6%, 86.3%) 85.9% (85.1%, 86.7%) 89.0% (88.1%, 89.8%)

3.2 Burning Man Media

3.2.2 Media not managed by Burning Man Project

2022 2023
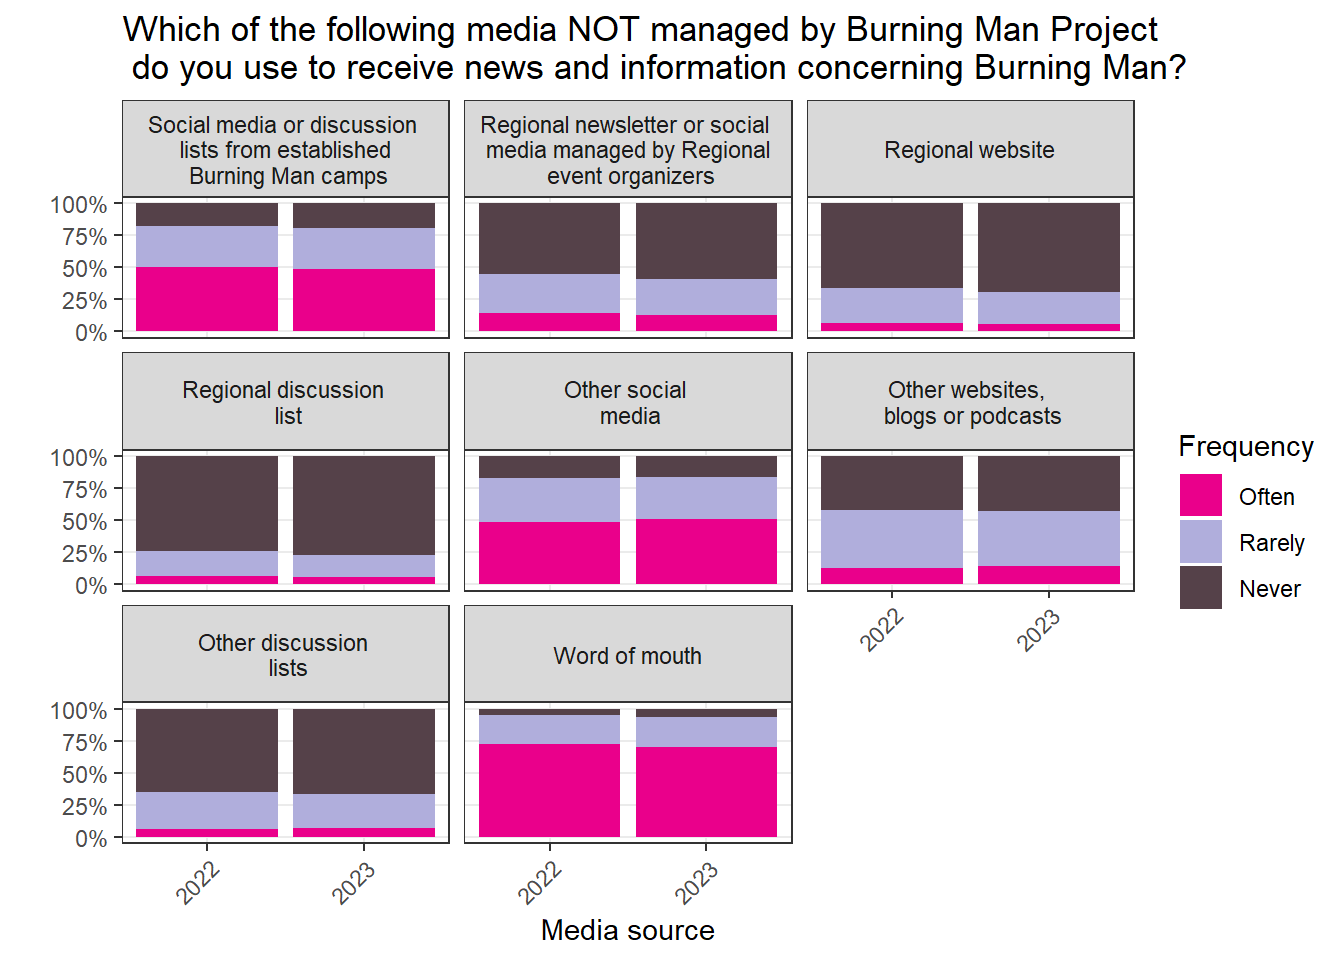
Other discussion lists (Never) 65.0% (63.8%, 66.1%) 66.7% (65.2%, 68.1%)
Other discussion lists (Rarely) 28.7% (27.6%, 29.8%) 26.7% (25.3%, 28.0%)
Other discussion lists (Often) 6.3% (5.8%, 7.0%) 6.6% (5.9%, 7.4%)
Other social media (Never) 17.2% (16.3%, 18.2%) 16.1% (15.0%, 17.2%)
Other social media (Rarely) 33.9% (32.8%, 35.1%) 33.3% (31.8%, 34.7%)
Other social media (Often) 48.8% (47.6%, 50.1%) 50.6% (49.1%, 52.2%)
Other websites, blogs or podcasts (Never) 42.0% (40.8%, 43.3%) 42.8% (41.3%, 44.4%)
Other websites, blogs or podcasts (Rarely) 45.4% (44.2%, 46.6%) 43.2% (41.6%, 44.7%)
Other websites, blogs or podcasts (Often) 12.6% (11.8%, 13.4%) 14.0% (13.0%, 15.1%)
Regional discussion list (Never) 74.4% (73.4%, 75.5%) 77.6% (76.3%, 78.8%)
Regional discussion list (Rarely) 19.4% (18.5%, 20.4%) 17.1% (16.1%, 18.3%)
Regional discussion list (Often) 6.1% (5.6%, 6.7%) 5.3% (4.7%, 6.0%)
Regional newsletter or social media managed by Regional event organizers (Never) 55.2% (54.0%, 56.4%) 59.5% (58.0%, 60.9%)
Regional newsletter or social media managed by Regional event organizers (Rarely) 30.3% (29.2%, 31.5%) 28.1% (26.8%, 29.4%)
Regional newsletter or social media managed by Regional event organizers (Often) 14.5% (13.6%, 15.3%) 12.5% (11.5%, 13.4%)
Regional website (Never) 66.2% (65.1%, 67.4%) 69.6% (68.2%, 70.9%)
Regional website (Rarely) 27.2% (26.1%, 28.3%) 24.3% (23.1%, 25.6%)
Regional website (Often) 6.6% (6.0%, 7.2%) 6.1% (5.5%, 6.8%)
Social media or discussion lists from established Burning Man camps (Never) 17.8% (16.9%, 18.8%) 19.0% (17.8%, 20.3%)
Social media or discussion lists from established Burning Man camps (Rarely) 31.8% (30.7%, 32.9%) 32.5% (31.1%, 34.0%)
Social media or discussion lists from established Burning Man camps (Often) 50.4% (49.2%, 51.6%) 48.4% (46.9%, 50.0%)
Word of mouth (Never) 5.2% (4.7%, 5.8%) 6.1% (5.4%, 7.0%)
Word of mouth (Rarely) 22.7% (21.7%, 23.7%) 23.5% (22.2%, 24.8%)
Word of mouth (Often) 72.1% (71.0%, 73.2%) 70.4% (69.0%, 71.8%)

3.2.3 Most valuable types of information coming from Burning Man Project

2014 2015 2016 2017 2018 2019 2022 2023
Other 1.8% (1.5%, 2.1%) 1.2% (0.9%, 1.4%) 0.9% (0.7%, 1.1%) 1.0% (0.8%, 1.2%) 1.1% (0.9%, 1.4%) 0.9% (0.7%, 1.2%) 0.7% (0.5%, 0.9%) 0.5% (0.4%, 0.7%)
Information about non-profit activities -- 6.9% (6.3%, 7.5%) 11.1% (10.2%, 12.0%) 13.7% (13.0%, 14.5%) 13.7% (12.9%, 14.5%) 9.3% (8.6%, 10.0%) 5.2% (4.7%, 5.7%) 3.8% (3.3%, 4.3%)
Information supporting R.I.D.E. -- -- -- -- -- -- 10.1% (9.4%, 10.8%) 9.6% (8.7%, 10.5%)
Bay Area events 17.5% (16.7%, 18.3%) 15.6% (14.8%, 16.5%) 14.5% (13.6%, 15.4%) 14.1% (13.4%, 14.9%) 14.3% (13.5%, 15.2%) 13.9% (13.0%, 14.7%) 10.6% (9.9%, 11.3%) 10.2% (9.3%, 11.1%)
Events around the world 12.7% (12.0%, 13.4%) 14.0% (13.2%, 14.9%) 14.5% (13.5%, 15.5%) 13.5% (12.7%, 14.3%) 14.7% (13.9%, 15.6%) 12.5% (11.7%, 13.3%) 10.7% (10.0%, 11.5%) 12.1% (11.1%, 13.1%)
Resources about sustainability at Burning Man -- -- -- -- -- -- 11.5% (10.8%, 12.3%) 12.1% (11.2%, 13.1%)
Stories about Burners from around the world 28.5% (27.6%, 29.4%) 29.1% (28.0%, 30.2%) 32.3% (31.0%, 33.6%) 33.5% (32.4%, 34.6%) 32.7% (31.6%, 33.8%) 23.4% (22.4%, 24.5%) 17.1% (16.2%, 18.0%) 14.2% (13.2%, 15.3%)
Information about camps -- -- -- -- -- 18.7% (17.7%, 19.6%) 16.0% (15.2%, 16.9%) 18.5% (17.4%, 19.8%)
Opportunities to create or assist with art -- -- -- -- -- -- 23.5% (22.5%, 24.5%) 21.4% (20.2%, 22.6%)
Volunteer opportunities with teams or departments 22.6% (21.8%, 23.5%) 21.4% (20.4%, 22.3%) 23.0% (21.8%, 24.1%) 25.8% (24.8%, 26.8%) 27.0% (25.9%, 28.0%) 28.3% (27.2%, 29.4%) 23.7% (22.8%, 24.8%) 23.8% (22.6%, 25.1%)
Burning Man Regional events 25.5% (24.6%, 26.4%) 27.8% (26.8%, 28.9%) 29.3% (28.1%, 30.6%) 29.3% (28.2%, 30.3%) 29.2% (28.1%, 30.2%) 28.2% (27.1%, 29.3%) 25.1% (24.1%, 26.2%) 24.9% (23.6%, 26.2%)
Photos and videos from Black Rock City 54.3% (53.3%, 55.3%) 52.4% (51.2%, 53.5%) 44.8% (43.4%, 46.2%) 43.3% (42.1%, 44.5%) 39.2% (38.0%, 40.3%) 28.4% (27.3%, 29.5%) 28.7% (27.7%, 29.8%) 26.8% (25.5%, 28.1%)
Black Rock City preparation information 43.5% (42.5%, 44.5%) 42.2% (41.1%, 43.3%) 40.6% (39.2%, 41.9%) 40.4% (39.3%, 41.6%) 40.5% (39.3%, 41.7%) 29.3% (28.2%, 30.4%) 28.0% (26.9%, 29.0%) 28.5% (27.2%, 29.9%)
Black Rock City events 58.0% (57.0%, 59.0%) 59.1% (57.9%, 60.2%) 57.8% (56.5%, 59.2%) 53.2% (52.1%, 54.4%) 56.4% (55.2%, 57.6%) 55.2% (54.0%, 56.4%) 45.7% (44.5%, 46.9%) 53.4% (51.9%, 54.8%)

3.2.4 Listened to BMIR (Burning Man Information Radio) this year

2014 2015 2016 2017 2018 2019 2022 2023
Listened online 18.0% (17.3%, 18.8%) 16.2% (15.4%, 17.0%) -- 11.2% (10.5%, 11.9%) 11.8% (11.1%, 12.5%) 10.3% (9.6%, 11.0%) 9.1% (8.4%, 9.8%) 12.2% (11.3%, 13.1%)
Listened while traveled 25.6% (24.7%, 26.5%) 25.5% (24.6%, 26.5%) 32.5% (31.2%, 33.7%) 22.0% (21.1%, 23.0%) 23.2% (22.3%, 24.2%) 21.5% (20.6%, 22.5%) 24.5% (23.5%, 25.5%) 23.2% (22.0%, 24.4%)
Listened over the air at Black Rock City 73.9% (73.1%, 74.8%) 68.0% (66.9%, 69.0%) 61.2% (59.9%, 62.6%) 64.6% (63.5%, 65.7%) 64.3% (63.1%, 65.4%) 60.4% (59.2%, 61.5%) 68.1% (67.0%, 69.3%) 76.4% (75.0%, 77.7%)
Listened over speakers at BMIR or Center Camp 15.9% (15.2%, 16.7%) 16.0% (15.2%, 16.9%) 14.2% (13.3%, 15.1%) 13.2% (12.5%, 14.0%) 13.7% (12.9%, 14.5%) 12.0% (11.3%, 12.8%) 6.8% (6.2%, 7.4%) 10.4% (9.6%, 11.3%)
Did not know about BMIR 1.2% (1.0%, 1.4%) 2.0% (1.7%, 2.3%) 2.5% (2.1%, 3.1%) 2.8% (2.4%, 3.3%) 2.3% (2.0%, 2.7%) 3.3% (2.9%, 3.8%) 2.2% (1.8%, 2.6%) 1.2% (0.8%, 1.6%)
Knew about BMIR, but did not listen to it 10.0% (9.4%, 10.6%) 15.0% (14.2%, 15.9%) 16.4% (15.4%, 17.4%) 18.0% (17.1%, 19.0%) 17.4% (16.6%, 18.4%) 20.2% (19.2%, 21.2%) 14.5% (13.7%, 15.4%) 9.5% (8.5%, 10.5%)

3.3 Volunteerism and donations

3.3.1 Volunteered in the last year

2016 2017 2018 2019 2022 2023
Self-initiated good deeds 36.9% (35.6%, 38.2%) 37.1% (36.0%, 38.3%) 35.3% (34.2%, 36.5%) 35.7% (34.6%, 36.9%) 33.3% (32.2%, 34.5%) 29.6% (28.4%, 30.9%)
Community groups or clubs 27.7% (26.6%, 28.9%) 27.1% (26.1%, 28.1%) 25.3% (24.3%, 26.3%) 23.1% (22.1%, 24.1%) 21.7% (20.8%, 22.7%) 21.6% (20.5%, 22.8%)
Art Projects 21.1% (20.1%, 22.2%) 23.0% (22.1%, 24.0%) 22.7% (21.7%, 23.6%) 23.0% (22.0%, 24.0%) 19.3% (18.4%, 20.2%) 15.3% (14.4%, 16.3%)
Black Rock City 20.8% (19.8%, 21.8%) 23.7% (22.8%, 24.7%) 12.8% (12.0%, 13.5%) 15.4% (14.6%, 16.3%) 15.3% (14.5%, 16.1%) 12.6% (11.8%, 13.5%)
Human rights or poverty- related initiatives -- -- -- 15.3% (14.5%, 16.1%) 13.6% (12.8%, 14.4%) 12.5% (11.6%, 13.5%)
Animals or environmental initiatives 14.8% (13.8%, 15.8%) 15.6% (14.8%, 16.5%) 14.3% (13.5%, 15.1%) 13.3% (12.5%, 14.1%) 11.1% (10.4%, 11.8%) 11.1% (10.3%, 12.1%)
Schools or universities 15.3% (14.3%, 16.3%) 14.6% (13.8%, 15.5%) 12.5% (11.8%, 13.3%) 13.5% (12.7%, 14.3%) 10.4% (9.7%, 11.1%) 10.2% (9.4%, 11.0%)
Burning Man Regionals 11.6% (10.8%, 12.5%) 14.3% (13.5%, 15.1%) 10.3% (9.6%, 11.0%) 11.9% (11.1%, 12.7%) 10.1% (9.4%, 10.8%) 9.8% (9.1%, 10.7%)
Health-related initiatives -- -- -- 10.7% (10.0%, 11.5%) 10.3% (9.6%, 11.0%) 9.3% (8.6%, 10.1%)
Political campaigns or voter registration 9.9% (9.2%, 10.6%) 11.4% (10.7%, 12.1%) 9.5% (8.8%, 10.1%) 9.9% (9.2%, 10.6%) 8.2% (7.6%, 8.8%) 5.8% (5.2%, 6.4%)
Religious or faith-based initiatives -- -- -- 3.0% (2.6%, 3.4%) 2.5% (2.1%, 2.8%) 2.4% (2.0%, 2.8%)
Fly Ranch Project -- -- -- 1.2% (1.0%, 1.5%) 1.0% (0.8%, 1.2%) 0.9% (0.7%, 1.2%)
Burners Without Borders 1.0% (0.8%, 1.2%) 1.4% (1.2%, 1.7%) 1.2% (1.0%, 1.5%) 1.8% (1.5%, 2.2%) 0.9% (0.8%, 1.2%) 0.9% (0.7%, 1.2%)
Other non-profits and charities 11.8% (11.0%, 12.7%) 11.5% (10.8%, 12.3%) 10.6% (10.0%, 11.3%) 8.0% (7.4%, 8.7%) 7.1% (6.5%, 7.7%) 7.0% (6.3%, 7.7%)

3.3.2 Approximate average hours per month spent on volunteer efforts last year

2018 2019 2022 2023
10^th^ percentile 2 (2, 3) 1 (1, 2) 1 (1, 2) 1 (1, 2)
25^th^ percentile 4 (4, 5) 3 (3, 4) 3 (3, 4) 2 (2, 3)
Median 8 (8, 10) 7 (6, 8) 8 (8, 10) 5 (5, 6)
75^th^ percentile 20 (20, 25) 15 (15, 17) 20 (20, 25) 12 (12, 15)
90^th^ percentile 40 (40, 50) 40 (40, 50) 40 (40, 50) 30 (30, 40)
99^th^ percentile 200 (200, 300) 200 (200, 300) 200 (200, 300) 150 (120, 200)

3.3.3 Made a charitable donation in the last year

2019 2022 2023
Human rights or poverty- related initiatives 27.5% (26.4%, 28.5%) 28.1% (27.0%, 29.1%) 24.0% (22.8%, 25.3%)
Animals or environmental initiatives 20.9% (20.0%, 21.9%) 19.6% (18.7%, 20.6%) 18.8% (17.8%, 20.0%)
Self-initiated good deeds 18.6% (17.7%, 19.6%) 18.5% (17.6%, 19.4%) 16.7% (15.7%, 17.7%)
Community groups or clubs 17.2% (16.3%, 18.1%) 17.4% (16.6%, 18.3%) 16.3% (15.3%, 17.3%)
Art Projects 22.8% (21.8%, 23.8%) 20.1% (19.2%, 21.0%) 15.0% (14.1%, 16.0%)
Health-related initiatives 20.6% (19.7%, 21.6%) 18.6% (17.7%, 19.5%) 15.8% (14.9%, 16.9%)
Black Rock City 9.5% (8.8%, 10.2%) 19.7% (18.8%, 20.6%) 11.9% (11.1%, 12.8%)
Political campaigns or voter registration 18.7% (17.8%, 19.6%) 15.7% (14.9%, 16.5%) 11.1% (10.3%, 12.0%)
Schools or universities 13.5% (12.7%, 14.3%) 10.8% (10.1%, 11.5%) 10.1% (9.3%, 10.9%)
Burning Man Regionals 3.6% (3.2%, 4.1%) 3.5% (3.1%, 4.0%) 4.0% (3.5%, 4.6%)
Religious or faith-based initiatives 4.3% (3.9%, 4.8%) 3.7% (3.3%, 4.1%) 3.5% (3.0%, 4.1%)
Burners Without Borders 1.5% (1.2%, 1.8%) 1.0% (0.8%, 1.2%) 0.9% (0.7%, 1.2%)
Fly Ranch Project 0.8% (0.6%, 1.1%) 0.6% (0.5%, 0.8%) 0.3% (0.2%, 0.4%)
Other non-profits and charities 8.2% (7.6%, 8.9%) 9.0% (8.3%, 9.7%) 8.0% (7.3%, 8.8%)

3.3.4 Inspiration to volunteer, donate, or get involved after going to Black Rock City

2016 2017 2018 2019 2022 2023
No 19.7% (18.7%, 20.7%) 19.9% (18.9%, 20.8%) 17.6% (16.7%, 18.5%) 16.3% (15.4%, 17.2%) 19.7% (18.8%, 20.7%) 17.5% (16.4%, 18.6%)
Maybe 30.5% (29.3%, 31.8%) 29.5% (28.4%, 30.6%) 31.5% (30.5%, 32.6%) 28.5% (27.4%, 29.6%) 30.6% (29.5%, 31.7%) 30.0% (28.6%, 31.3%)
Yes 49.8% (48.4%, 51.1%) 50.6% (49.4%, 51.8%) 50.9% (49.7%, 52.0%) 55.2% (54.0%, 56.4%) 49.7% (48.5%, 50.9%) 52.6% (51.1%, 54.1%)

3.4 New skills

3.4.1 Inspiration to practice or learn skills after going to Black Rock City

2016 2017 2018 2019 2022 2023
Art creation/crafting 58.4% (57.1%, 59.8%) 56.2% (55.0%, 57.4%) 59.9% (58.8%, 61.1%) 60.8% (59.6%, 62.0%) 59.2% (58.1%, 60.4%) 59.4% (57.9%, 60.8%)
Self-awareness or emotional skills 58.1% (56.8%, 59.4%) 57.6% (56.4%, 58.8%) 56.4% (55.3%, 57.6%) 51.8% (50.6%, 53.0%) 48.6% (47.4%, 49.8%) 48.7% (47.2%, 50.2%)
Self-care strategies -- -- 43.0% (41.8%, 44.1%) 40.4% (39.2%, 41.6%) 39.6% (38.4%, 40.8%) 39.2% (37.7%, 40.6%)
Survival skills -- -- 35.2% (34.1%, 36.3%) 29.0% (28.0%, 30.1%) 32.3% (31.2%, 33.4%) 38.4% (36.9%, 39.8%)
Physical training -- -- -- 37.2% (36.0%, 38.4%) 34.2% (33.1%, 35.4%) 34.5% (33.1%, 36.0%)
Leadership or interpersonal skills 37.0% (35.7%, 38.3%) 39.0% (37.8%, 40.2%) 40.3% (39.2%, 41.5%) 37.8% (36.6%, 38.9%) 34.4% (33.3%, 35.6%) 32.7% (31.3%, 34.1%)
Performance art 25.7% (24.5%, 26.9%) 24.7% (23.6%, 25.7%) 26.4% (25.4%, 27.5%) 29.7% (28.6%, 30.8%) 28.9% (27.8%, 30.0%) 31.3% (29.9%, 32.7%)
Project management 26.2% (25.0%, 27.4%) 26.7% (25.7%, 27.8%) 29.2% (28.2%, 30.3%) 25.8% (24.7%, 26.8%) 23.2% (22.2%, 24.2%) 22.7% (21.5%, 24.0%)
Community organizing or civic engagement -- -- 24.4% (23.4%, 25.4%) 24.3% (23.3%, 25.3%) 23.6% (22.6%, 24.7%) 23.2% (22.0%, 24.5%)
Carpentry or metal work 26.1% (24.9%, 27.2%) 26.1% (25.1%, 27.2%) 26.6% (25.6%, 27.7%) 21.0% (20.0%, 22.0%) 20.2% (19.3%, 21.2%) 17.9% (16.8%, 19.0%)
Mediation skills 26.6% (25.4%, 27.8%) 27.1% (26.0%, 28.2%) 24.4% (23.4%, 25.4%) 22.3% (21.3%, 23.3%) 17.6% (16.7%, 18.5%) 17.7% (16.6%, 18.9%)
Electrical engineering or electronics design -- -- -- 17.0% (16.1%, 17.9%) 15.7% (14.8%, 16.6%) 15.2% (14.2%, 16.3%)
Construction, heavy machinery, or mechanical work 15.1% (14.1%, 16.1%) 15.6% (14.7%, 16.5%) 14.5% (13.7%, 15.4%) 15.7% (14.8%, 16.6%) 15.5% (14.6%, 16.4%) 13.9% (12.9%, 14.9%)
Graphic design 10.6% (9.8%, 11.5%) 9.8% (9.1%, 10.6%) 10.3% (9.6%, 11.0%) 9.2% (8.5%, 9.9%) 8.1% (7.5%, 8.8%) 8.2% (7.4%, 9.1%)
Other -- 3.4% (3.0%, 3.9%) 3.0% (2.6%, 3.4%) 2.7% (2.3%, 3.1%) 2.6% (2.2%, 3.0%) 2.3% (2.0%, 2.8%)

3.4.2 Have any of these skills proved useful in the default world?

2016 2017 2018 2019 2022 2023
Very useful 55.9% (54.5%, 57.4%) 58.2% (56.9%, 59.5%) 58.4% (57.2%, 59.6%) 61.0% (59.8%, 62.3%) 62.3% (61.0%, 63.5%) 59.2% (57.6%, 60.8%)
Somewhat useful 32.0% (30.6%, 33.3%) 30.8% (29.6%, 32.0%) 33.1% (32.0%, 34.3%) 30.8% (29.7%, 32.0%) 30.3% (29.1%, 31.4%) 32.2% (30.7%, 33.7%)
May be at some point 11.7% (10.8%, 12.7%) 10.8% (10.0%, 11.7%) 8.2% (7.5%, 8.9%) 7.7% (7.1%, 8.4%) 7.2% (6.5%, 7.9%) 8.4% (7.5%, 9.3%)
Not at all 0.4% (0.3%, 0.6%) 0.2% (0.1%, 0.4%) 0.3% (0.2%, 0.4%) 0.4% (0.3%, 0.6%) 0.3% (0.2%, 0.5%) 0.2% (0.1%, 0.5%)

3.4.3 How are you using these skills outside of Black Rock City?

2017 2018 2019 2022 2023
I am creating things for myself or my family 66.0% (64.7%, 67.2%) 66.8% (65.6%, 67.9%) 67.6% (66.4%, 68.8%) 60.7% (59.5%, 61.9%) 60.2% (58.8%, 61.7%)
I am using my time at home to create things that I will bring to Black Rock City 43.1% (41.9%, 44.4%) 45.5% (44.3%, 46.7%) 46.2% (45.0%, 47.5%) 38.7% (37.6%, 39.9%) 36.8% (35.4%, 38.2%)
I am creating things for my home community 34.8% (33.6%, 36.0%) 34.0% (32.9%, 35.2%) 36.3% (35.1%, 37.5%) 33.5% (32.3%, 34.6%) 32.9% (31.5%, 34.3%)
I am teaching those skills to members of my home community 29.7% (28.6%, 30.9%) 30.1% (29.0%, 31.3%) 29.1% (28.0%, 30.3%) 25.3% (24.3%, 26.4%) 23.3% (22.1%, 24.5%)
I am not using these skills outside of Black Rock City -- 6.3% (5.7%, 7.0%) 5.2% (4.7%, 5.8%) 4.8% (4.3%, 5.4%) 5.9% (5.2%, 6.7%)

3.4.4 Impact of these new skills outside of Black Rock City

2018 2019 2022 2023
I feel more fulfilled as an individual 79.2% (78.2%, 80.2%) 79.6% (78.5%, 80.6%) 69.5% (68.4%, 70.6%) 69.9% (68.5%, 71.2%)
I am developing new and fulfilling relationships in my home community 39.3% (38.1%, 40.5%) 40.0% (38.7%, 41.2%) 35.2% (34.1%, 36.4%) 36.4% (35.0%, 37.9%)
These skills are not impacting my life outside of Black Rock City 7.3% (6.7%, 8.0%) 6.7% (6.1%, 7.4%) 6.3% (5.8%, 6.9%) 6.8% (6.1%, 7.7%)