| 2025 | |
|---|---|
| Never | 63.1% (61.5%, 64.7%) |
| Once | 13.7% (12.6%, 14.8%) |
| Multiple times | 23.2% (21.9%, 24.6%) |
| 2025 | |
|---|---|
| Never | 63.1% (61.5%, 64.7%) |
| Once | 13.7% (12.6%, 14.8%) |
| Multiple times | 23.2% (21.9%, 24.6%) |
| 2025 | |
|---|---|
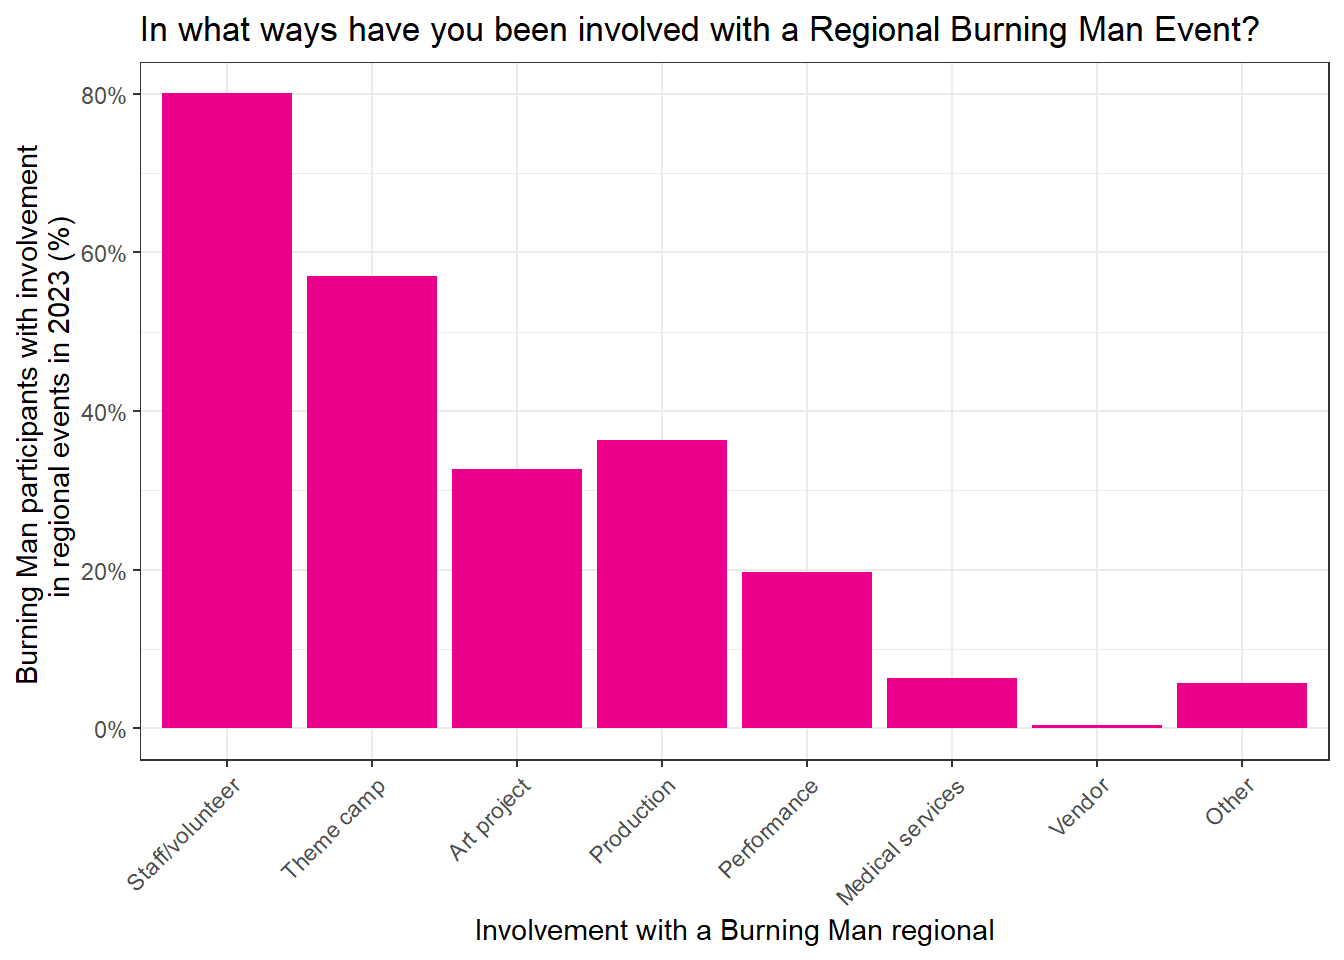
| Theme camp | 50.0% (47.2%, 52.8%) |
| Staff/volunteer | 36.8% (34.1%, 39.5%) |
| Art project | 25.1% (22.7%, 27.6%) |
| Meetings | 22.4% (20.1%, 24.8%) |
| Supporter | 20.8% (18.6%, 23.0%) |
| Production | 18.0% (16.0%, 20.2%) |
| Performance | 11.9% (10.2%, 13.9%) |
| Donor | 7.6% (6.3%, 9.2%) |
| Medical services | 2.4% (1.6%, 3.5%) |
| Vendor | 0.3% (0.1%, 0.7%) |
| Other | 4.3% (3.3%, 5.5%) |
| Not involved | 16.0% (14.0%, 18.2%) |
| 2015 | 2016 | 2017 | 2018 | 2019 | 2022 | 2023 | 2024 | 2025 | |
|---|---|---|---|---|---|---|---|---|---|
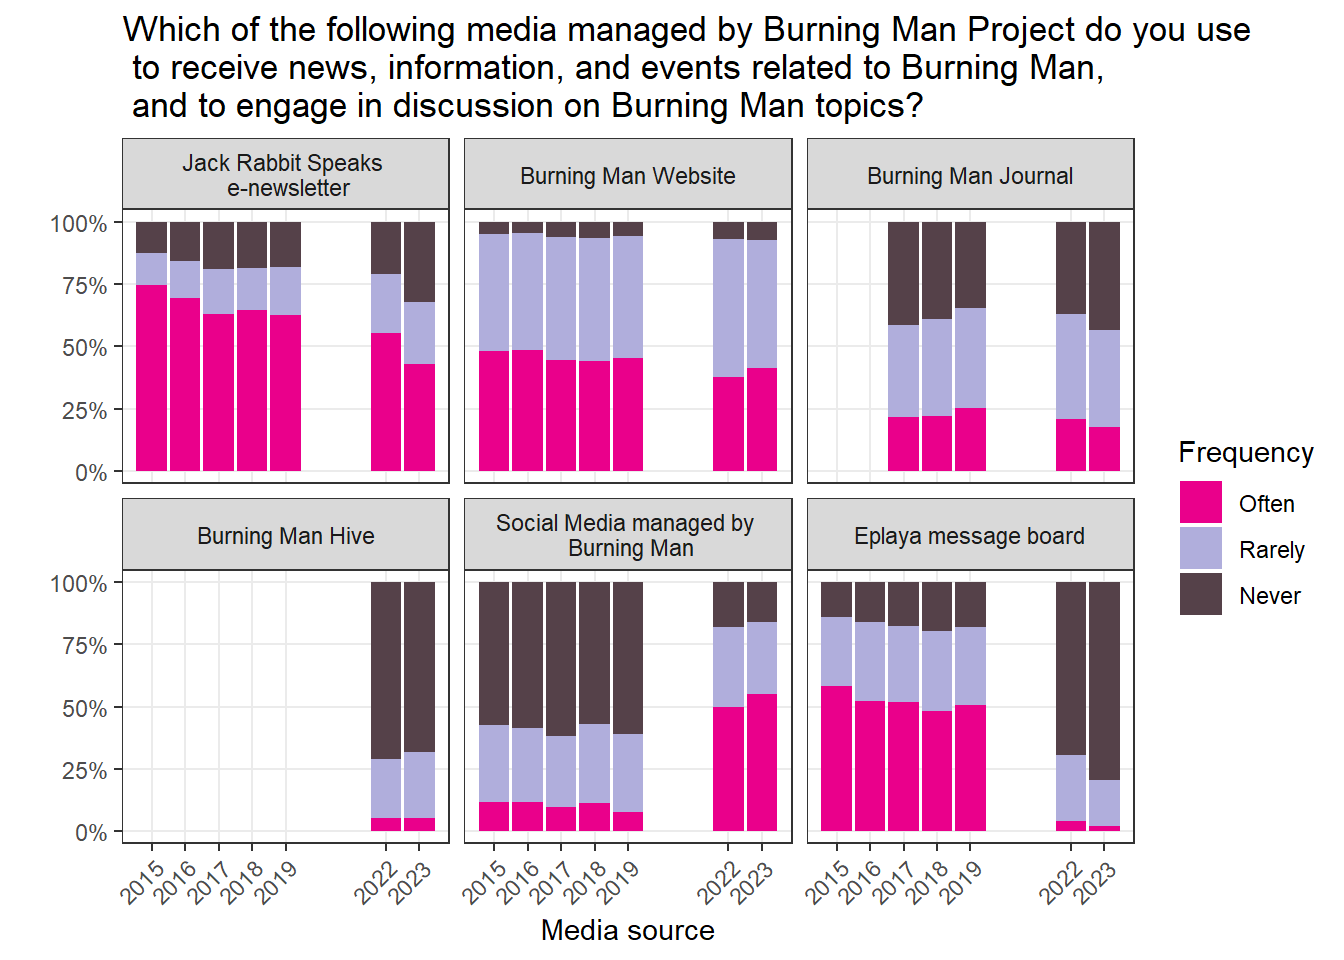
| Burning Man Hive (Never) | -- | -- | -- | -- | -- | 71.0% (69.9%, 72.1%) | 65.4% (64.1%, 66.7%) | 71.9% (70.3%, 73.5%) | 74.0% (72.4%, 75.5%) |
| Burning Man Hive (Rarely) | -- | -- | -- | -- | -- | 23.7% (22.7%, 24.7%) | 28.9% (27.7%, 30.1%) | 24.0% (22.5%, 25.5%) | 22.5% (21.0%, 24.0%) |
| Burning Man Hive (Often) | -- | -- | -- | -- | -- | 5.3% (4.8%, 5.9%) | 5.7% (5.1%, 6.4%) | 4.1% (3.5%, 4.9%) | 3.6% (2.9%, 4.4%) |
| Burning Man Journal (Never) | -- | -- | 41.3% (40.1%, 42.5%) | 39.1% (37.9%, 40.3%) | 34.4% (33.3%, 35.6%) | 37.0% (35.8%, 38.2%) | 39.8% (38.5%, 41.2%) | 47.0% (45.2%, 48.8%) | 49.7% (48.0%, 51.5%) |
| Burning Man Journal (Rarely) | -- | -- | 37.2% (36.1%, 38.4%) | 38.8% (37.6%, 40.0%) | 40.1% (38.9%, 41.3%) | 42.2% (41.0%, 43.4%) | 39.9% (38.6%, 41.3%) | 39.0% (37.2%, 40.7%) | 38.2% (36.6%, 39.9%) |
| Burning Man Journal (Often) | -- | -- | 21.5% (20.6%, 22.5%) | 22.2% (21.2%, 23.2%) | 25.4% (24.4%, 26.5%) | 20.9% (19.9%, 21.9%) | 20.2% (19.2%, 21.3%) | 14.0% (12.9%, 15.3%) | 12.0% (10.9%, 13.2%) |
| Burning Man Website (Never) | 4.9% (4.4%, 5.5%) | 4.5% (3.9%, 5.1%) | 6.0% (5.4%, 6.6%) | 6.5% (5.9%, 7.1%) | 5.6% (5.0%, 6.2%) | 6.7% (6.1%, 7.3%) | 6.5% (5.8%, 7.2%) | 9.1% (8.1%, 10.3%) | 8.3% (7.4%, 9.3%) |
| Burning Man Website (Rarely) | 46.8% (45.7%, 48.0%) | 47.0% (45.7%, 48.4%) | 49.3% (48.2%, 50.5%) | 49.4% (48.2%, 50.6%) | 49.0% (47.8%, 50.2%) | 55.7% (54.5%, 56.9%) | 51.5% (50.2%, 52.9%) | 55.9% (54.1%, 57.6%) | 56.2% (54.5%, 57.9%) |
| Burning Man Website (Often) | 48.2% (47.1%, 49.4%) | 48.5% (47.1%, 49.9%) | 44.7% (43.6%, 45.9%) | 44.2% (43.0%, 45.3%) | 45.5% (44.3%, 46.6%) | 37.7% (36.5%, 38.8%) | 42.0% (40.7%, 43.3%) | 35.0% (33.3%, 36.7%) | 35.5% (33.9%, 37.1%) |
| Eplaya message board (Never) | 57.5% (56.3%, 58.7%) | 58.8% (57.4%, 60.2%) | 61.8% (60.6%, 63.0%) | 56.9% (55.6%, 58.1%) | 61.0% (59.8%, 62.1%) | 69.6% (68.5%, 70.7%) | 76.3% (75.2%, 77.4%) | 80.1% (78.6%, 81.4%) | 84.3% (83.0%, 85.5%) |
| Eplaya message board (Rarely) | 31.0% (29.9%, 32.2%) | 29.8% (28.5%, 31.1%) | 28.4% (27.4%, 29.5%) | 31.9% (30.8%, 33.1%) | 31.6% (30.4%, 32.7%) | 26.5% (25.5%, 27.6%) | 21.1% (20.1%, 22.2%) | 18.3% (17.0%, 19.7%) | 14.2% (13.1%, 15.5%) |
| Eplaya message board (Often) | 11.5% (10.7%, 12.3%) | 11.4% (10.5%, 12.4%) | 9.8% (9.1%, 10.5%) | 11.2% (10.4%, 12.0%) | 7.5% (6.9%, 8.2%) | 3.8% (3.4%, 4.3%) | 2.6% (2.2%, 3.0%) | 1.7% (1.3%, 2.1%) | 1.5% (1.1%, 2.0%) |
| Jack Rabbit Speaks e-newsletter (Never) | 12.7% (11.9%, 13.5%) | 15.5% (14.5%, 16.7%) | 18.9% (17.9%, 19.9%) | 18.4% (17.4%, 19.4%) | 18.3% (17.3%, 19.2%) | 20.9% (19.9%, 22.0%) | 26.4% (25.2%, 27.7%) | 28.0% (26.3%, 29.8%) | 25.8% (24.4%, 27.4%) |
| Jack Rabbit Speaks e-newsletter (Rarely) | 12.7% (11.9%, 13.5%) | 14.9% (13.9%, 15.9%) | 18.2% (17.3%, 19.1%) | 17.2% (16.3%, 18.1%) | 19.1% (18.2%, 20.1%) | 23.8% (22.8%, 24.9%) | 25.3% (24.2%, 26.5%) | 26.3% (24.7%, 27.8%) | 29.8% (28.2%, 31.3%) |
| Jack Rabbit Speaks e-newsletter (Often) | 74.6% (73.6%, 75.6%) | 69.6% (68.2%, 70.9%) | 62.9% (61.8%, 64.1%) | 64.5% (63.3%, 65.6%) | 62.6% (61.5%, 63.8%) | 55.3% (54.1%, 56.5%) | 48.3% (46.9%, 49.6%) | 45.7% (44.0%, 47.5%) | 44.4% (42.7%, 46.1%) |
| Social Media managed by Burning Man (Never) | 13.9% (13.1%, 14.7%) | 16.1% (15.1%, 17.2%) | 17.7% (16.8%, 18.6%) | 19.9% (18.9%, 20.9%) | 18.0% (17.1%, 19.0%) | 18.3% (17.3%, 19.2%) | 16.5% (15.5%, 17.5%) | 20.8% (19.3%, 22.3%) | 22.5% (21.2%, 24.0%) |
| Social Media managed by Burning Man (Rarely) | 28.0% (27.0%, 29.0%) | 31.8% (30.5%, 33.2%) | 30.5% (29.4%, 31.6%) | 31.8% (30.7%, 32.9%) | 31.3% (30.2%, 32.5%) | 32.0% (30.9%, 33.1%) | 30.7% (29.5%, 31.9%) | 30.6% (29.0%, 32.2%) | 31.5% (30.0%, 33.1%) |
| Social Media managed by Burning Man (Often) | 58.1% (56.9%, 59.2%) | 52.1% (50.7%, 53.5%) | 51.9% (50.7%, 53.0%) | 48.4% (47.2%, 49.6%) | 50.6% (49.4%, 51.8%) | 49.8% (48.6%, 51.0%) | 52.8% (51.5%, 54.2%) | 48.7% (46.9%, 50.4%) | 45.9% (44.2%, 47.6%) |
| 2025 | |
|---|---|
| Burningman.org website | 63.7% (61.9%, 65.3%) |
| Online Survival Guide | 57.8% (56.0%, 59.5%) |
| Survival Guide booklet | 47.3% (45.6%, 49.0%) |
| Jackrabbit Speaks (JRS) newsletter | 44.4% (42.7%, 46.1%) |
| Burning Man Instagram | 26.8% (25.3%, 28.4%) |
| Burning Man Facebook | 20.4% (19.0%, 21.9%) |
| Burning Man Journal (blog) | 8.5% (7.6%, 9.5%) |
| Burning Man YouTube channel | 6.3% (5.4%, 7.2%) |
| Burning Man LIVE podcast | 4.5% (3.9%, 5.3%) |
| Burning Man HIVE | 4.2% (3.6%, 5.0%) |
| Burning Man TikTok | 2.8% (2.3%, 3.5%) |
| Other | 16.3% (15.0%, 17.6%) |
| 2014 | 2015 | 2016 | 2017 | 2018 | 2019 | 2022 | 2023 | 2024 | 2025 | |
|---|---|---|---|---|---|---|---|---|---|---|
| Events, gatherings, and things to do in Black Rock City | 58.0% (57.0%, 59.0%) | 59.1% (57.9%, 60.2%) | 57.8% (56.5%, 59.2%) | 53.2% (52.1%, 54.4%) | 56.4% (55.2%, 57.6%) | 55.2% (54.0%, 56.4%) | 45.7% (44.5%, 46.9%) | 52.5% (51.2%, 53.8%) | 54.3% (52.6%, 56.1%) | 63.1% (61.4%, 64.8%) |
| Photos/videos from Black Rock City | 54.3% (53.3%, 55.3%) | 52.4% (51.2%, 53.5%) | 44.8% (43.4%, 46.2%) | 43.3% (42.1%, 44.5%) | 39.2% (38.0%, 40.3%) | 28.4% (27.3%, 29.5%) | 28.7% (27.7%, 29.8%) | 27.3% (26.2%, 28.5%) | 26.1% (24.6%, 27.7%) | 38.4% (36.8%, 40.2%) |
| Black Rock City event preparation information | 43.5% (42.5%, 44.5%) | 42.2% (41.1%, 43.3%) | 40.6% (39.2%, 41.9%) | 40.4% (39.3%, 41.6%) | 40.5% (39.3%, 41.7%) | 29.3% (28.2%, 30.4%) | 28.0% (26.9%, 29.0%) | 27.9% (26.8%, 29.1%) | 25.8% (24.3%, 27.3%) | 36.7% (35.1%, 38.4%) |
| Volunteer opportunities with established teams/departments (Rangers, Gate, Greeters, etc.) | 22.6% (21.8%, 23.5%) | 21.4% (20.4%, 22.3%) | 23.0% (21.8%, 24.1%) | 25.8% (24.8%, 26.8%) | 27.0% (25.9%, 28.0%) | 28.3% (27.2%, 29.4%) | 23.7% (22.8%, 24.8%) | 24.9% (23.8%, 26.0%) | 23.3% (21.9%, 24.8%) | 32.0% (30.4%, 33.6%) |
| Burning Man Regional events | 25.5% (24.6%, 26.4%) | 27.8% (26.8%, 28.9%) | 29.3% (28.1%, 30.6%) | 29.3% (28.2%, 30.3%) | 29.2% (28.1%, 30.2%) | 28.2% (27.1%, 29.3%) | 25.1% (24.1%, 26.2%) | 25.3% (24.2%, 26.5%) | 22.2% (20.8%, 23.7%) | 30.7% (29.1%, 32.3%) |
| Information about camps offering activities and/or seeking members | -- | -- | -- | -- | -- | 18.7% (17.7%, 19.6%) | 16.0% (15.2%, 16.9%) | 17.1% (16.1%, 18.1%) | 17.6% (16.3%, 19.0%) | 29.8% (28.3%, 31.5%) |
| Opportunities to create and/or assist with art (or other artistic endeavors) | -- | -- | -- | -- | -- | -- | 23.5% (22.5%, 24.5%) | 21.7% (20.7%, 22.8%) | 24.2% (22.7%, 25.7%) | 28.5% (27.0%, 30.1%) |
| Stories about Burners around the world | 28.5% (27.6%, 29.4%) | 29.1% (28.0%, 30.2%) | 32.3% (31.0%, 33.6%) | 33.5% (32.4%, 34.6%) | 32.7% (31.6%, 33.8%) | 23.4% (22.4%, 24.5%) | 17.1% (16.2%, 18.0%) | 14.0% (13.1%, 14.9%) | 15.6% (14.3%, 16.9%) | 22.6% (21.1%, 24.1%) |
| Resources about environmental sustainability as it relates to Burning Man | -- | -- | -- | -- | -- | -- | 11.5% (10.8%, 12.3%) | 11.8% (11.0%, 12.7%) | 9.9% (8.9%, 10.9%) | 21.4% (20.0%, 22.8%) |
| Information about supporting Radical Inclusion, Diversity, and Equity in the Burning Man community | -- | -- | -- | -- | -- | -- | 10.1% (9.4%, 10.8%) | 9.0% (8.3%, 9.8%) | 7.1% (6.2%, 8.0%) | 16.2% (14.9%, 17.5%) |
| Events in cities around the country and around the world | 12.7% (12.0%, 13.4%) | 14.0% (13.2%, 14.9%) | 14.5% (13.5%, 15.5%) | 13.5% (12.7%, 14.3%) | 14.7% (13.9%, 15.6%) | 12.5% (11.7%, 13.3%) | 10.7% (10.0%, 11.5%) | 11.7% (10.8%, 12.6%) | 10.8% (9.8%, 11.9%) | 14.0% (12.8%, 15.3%) |
| Information about Burning Man Project's nonprofit programs | -- | 6.9% (6.3%, 7.5%) | 11.1% (10.2%, 12.0%) | 13.7% (13.0%, 14.5%) | 13.7% (12.9%, 14.5%) | 9.3% (8.6%, 10.0%) | 5.2% (4.7%, 5.7%) | 3.9% (3.5%, 4.4%) | 3.8% (3.2%, 4.5%) | 11.8% (10.8%, 13.0%) |
| Bay Area events | 17.5% (16.7%, 18.3%) | 15.6% (14.8%, 16.5%) | 14.5% (13.6%, 15.4%) | 14.1% (13.4%, 14.9%) | 14.3% (13.5%, 15.2%) | 13.9% (13.0%, 14.7%) | 10.6% (9.9%, 11.3%) | 10.2% (9.5%, 11.1%) | 11.8% (10.7%, 13.0%) | 11.7% (10.6%, 12.8%) |
| Other | 1.8% (1.5%, 2.1%) | 1.2% (0.9%, 1.4%) | 0.9% (0.7%, 1.1%) | 1.0% (0.8%, 1.2%) | 1.1% (0.9%, 1.4%) | 0.9% (0.7%, 1.2%) | 0.7% (0.5%, 0.9%) | 0.6% (0.4%, 0.8%) | 0.8% (0.6%, 1.2%) | 1.7% (1.3%, 2.2%) |

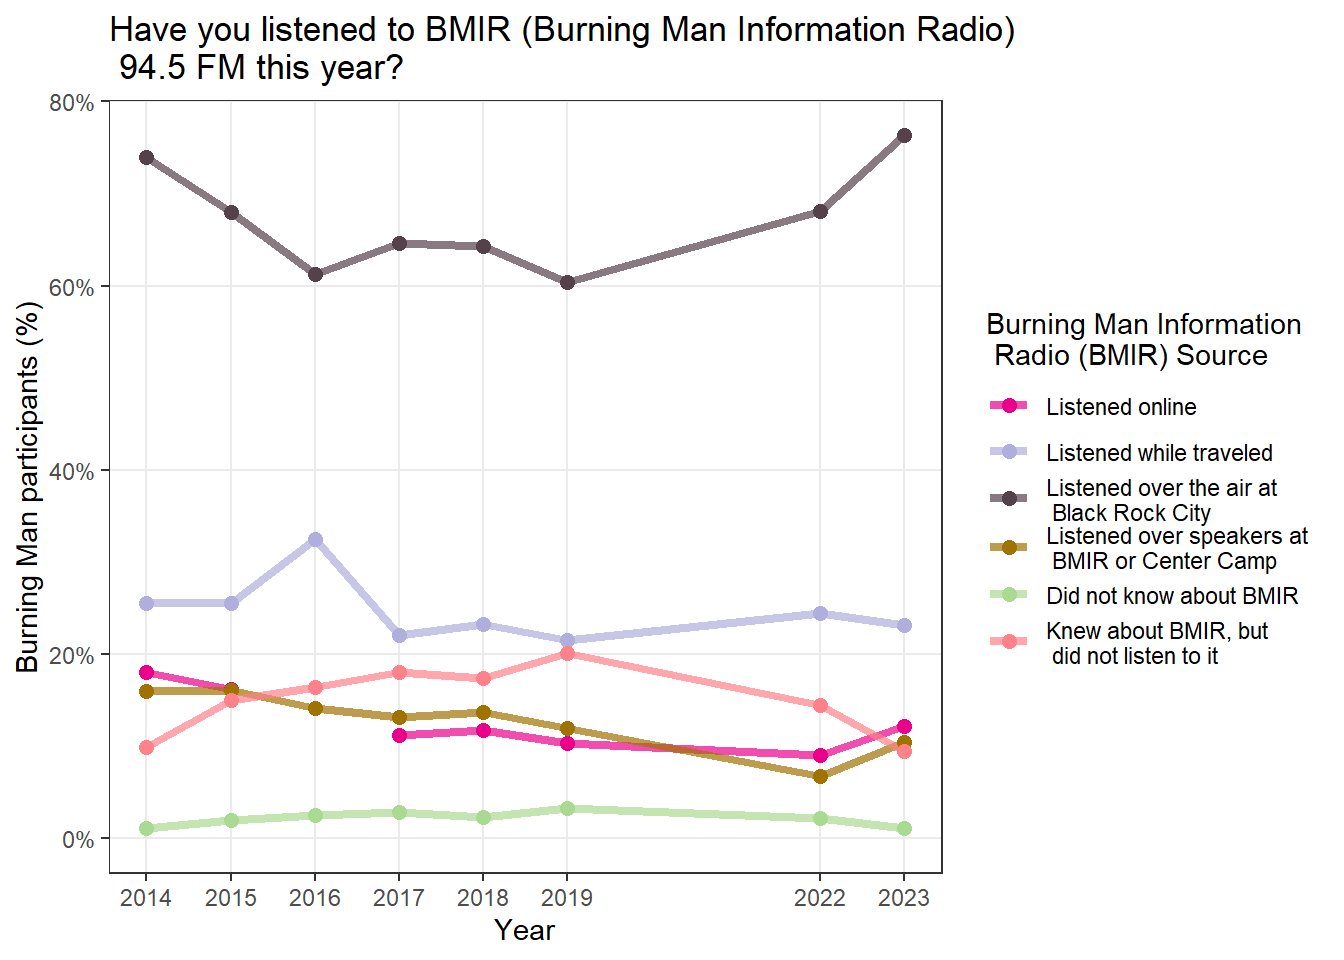
| 2025 | |
|---|---|
| BMIR (Burning Man Information Radio) 94.5 FM | 77.4% (76.0%, 78.8%) |
| GARS (Gate Advisory Radio Station) 95.1 FM | 36.8% (35.2%, 38.4%) |
| Other | 1.6% (1.3%, 2.1%) |
| None | 18.8% (17.5%, 20.2%) |
| 2025 | |
|---|---|
| Accessing the BRC Dashboard webpage (More than once a day) | 6.2% (5.4%, 7.0%) |
| Accessing the BRC Dashboard webpage (About once a day) | 10.2% (9.2%, 11.3%) |
| Accessing the BRC Dashboard webpage (Less than once per day) | 21.5% (20.1%, 22.9%) |
| Accessing the BRC Dashboard webpage (Never) | 62.2% (60.5%, 63.8%) |
| Browsing social media (More than once a day) | 3.5% (2.9%, 4.2%) |
| Browsing social media (About once a day) | 6.5% (5.8%, 7.4%) |
| Browsing social media (Less than once per day) | 18.7% (17.4%, 20.1%) |
| Browsing social media (Never) | 71.3% (69.7%, 72.8%) |
| Checking personal emails (More than once a day) | 2.2% (1.7%, 2.7%) |
| Checking personal emails (About once a day) | 7.5% (6.7%, 8.4%) |
| Checking personal emails (Less than once per day) | 21.1% (19.7%, 22.5%) |
| Checking personal emails (Never) | 69.3% (67.7%, 70.8%) |
| Checking work emails (More than once a day) | 2.1% (1.7%, 2.5%) |
| Checking work emails (About once a day) | 4.7% (4.0%, 5.4%) |
| Checking work emails (Less than once per day) | 11.7% (10.7%, 12.8%) |
| Checking work emails (Never) | 81.6% (80.2%, 82.8%) |
| Contacting fellow Burners at Black Rock City (More than once a day) | 9.8% (8.9%, 10.9%) |
| Contacting fellow Burners at Black Rock City (About once a day) | 14.2% (13.0%, 15.4%) |
| Contacting fellow Burners at Black Rock City (Less than once per day) | 25.4% (24.0%, 27.0%) |
| Contacting fellow Burners at Black Rock City (Never) | 50.5% (48.8%, 52.2%) |
| Contacting people outside of Black Rock City (More than once a day) | 5.2% (4.5%, 6.0%) |
| Contacting people outside of Black Rock City (About once a day) | 16.2% (14.9%, 17.5%) |
| Contacting people outside of Black Rock City (Less than once per day) | 41.1% (39.4%, 42.8%) |
| Contacting people outside of Black Rock City (Never) | 37.6% (35.9%, 39.2%) |
| Content capture (photo, video, or audio) (More than once a day) | 47.7% (46.0%, 49.4%) |
| Content capture (photo, video, or audio) (About once a day) | 21.2% (19.8%, 22.6%) |
| Content capture (photo, video, or audio) (Less than once per day) | 17.7% (16.5%, 19.0%) |
| Content capture (photo, video, or audio) (Never) | 13.4% (12.3%, 14.7%) |
| Playing music (More than once a day) | 16.8% (15.6%, 18.1%) |
| Playing music (About once a day) | 16.1% (14.9%, 17.4%) |
| Playing music (Less than once per day) | 21.5% (20.2%, 23.0%) |
| Playing music (Never) | 45.6% (43.9%, 47.3%) |
| Reading news (More than once a day) | 1.7% (1.3%, 2.2%) |
| Reading news (About once a day) | 5.5% (4.8%, 6.3%) |
| Reading news (Less than once per day) | 16.3% (15.1%, 17.6%) |
| Reading news (Never) | 76.5% (75.1%, 77.9%) |
| Saving information of new connections (More than once a day) | 7.3% (6.4%, 8.3%) |
| Saving information of new connections (About once a day) | 18.3% (16.9%, 19.6%) |
| Saving information of new connections (Less than once per day) | 37.6% (36.0%, 39.3%) |
| Saving information of new connections (Never) | 36.8% (35.2%, 38.4%) |
| Sharing content to social media (More than once a day) | 2.4% (1.9%, 3.0%) |
| Sharing content to social media (About once a day) | 3.1% (2.5%, 3.8%) |
| Sharing content to social media (Less than once per day) | 13.8% (12.7%, 15.0%) |
| Sharing content to social media (Never) | 80.7% (79.3%, 82.0%) |
| Streaming videos or movies (More than once a day) | 1.5% (1.2%, 2.1%) |
| Streaming videos or movies (About once a day) | 2.6% (2.1%, 3.2%) |
| Streaming videos or movies (Less than once per day) | 7.9% (7.0%, 8.9%) |
| Streaming videos or movies (Never) | 88.0% (86.8%, 89.0%) |
| Using third-party BRC apps (e.g., Dust, iBurn) (More than once a day) | 27.8% (26.3%, 29.3%) |
| Using third-party BRC apps (e.g., Dust, iBurn) (About once a day) | 20.7% (19.3%, 22.1%) |
| Using third-party BRC apps (e.g., Dust, iBurn) (Less than once per day) | 21.7% (20.3%, 23.1%) |
| Using third-party BRC apps (e.g., Dust, iBurn) (Never) | 29.9% (28.4%, 31.4%) |
| 2025 | |
|---|---|
| Communication apps | 63.3% (61.6%, 64.9%) |
| Social media apps | 27.3% (25.9%, 28.9%) |
| Audio streaming apps | 21.0% (19.6%, 22.4%) |
| Video streaming apps | 5.4% (4.7%, 6.2%) |
| Dating apps | 3.2% (2.6%, 3.8%) |
| Other | 7.2% (6.3%, 8.1%) |
| None of the above | 25.9% (24.4%, 27.4%) |

| 2025 | |
|---|---|
| Absolutely interested | 32.9% (31.3%, 34.6%) |
| Probably interested | 38.2% (36.5%, 39.8%) |
| Not sure | 20.9% (19.6%, 22.3%) |
| Probably not interested | 6.8% (6.0%, 7.6%) |
| Absolutely not interested | 1.2% (0.9%, 1.7%) |
| 2025 | |
|---|---|
| By volunteering with a Burning Man Project department | 44.5% (42.7%, 46.2%) |
| By volunteering within my theme camp | 54.2% (52.4%, 55.9%) |
| By contributing to an art project | 63.1% (61.4%, 64.8%) |
| By volunteering with a Regional Burning Man group | 34.8% (33.1%, 36.5%) |
| In other ways | 7.3% (6.4%, 8.3%) |
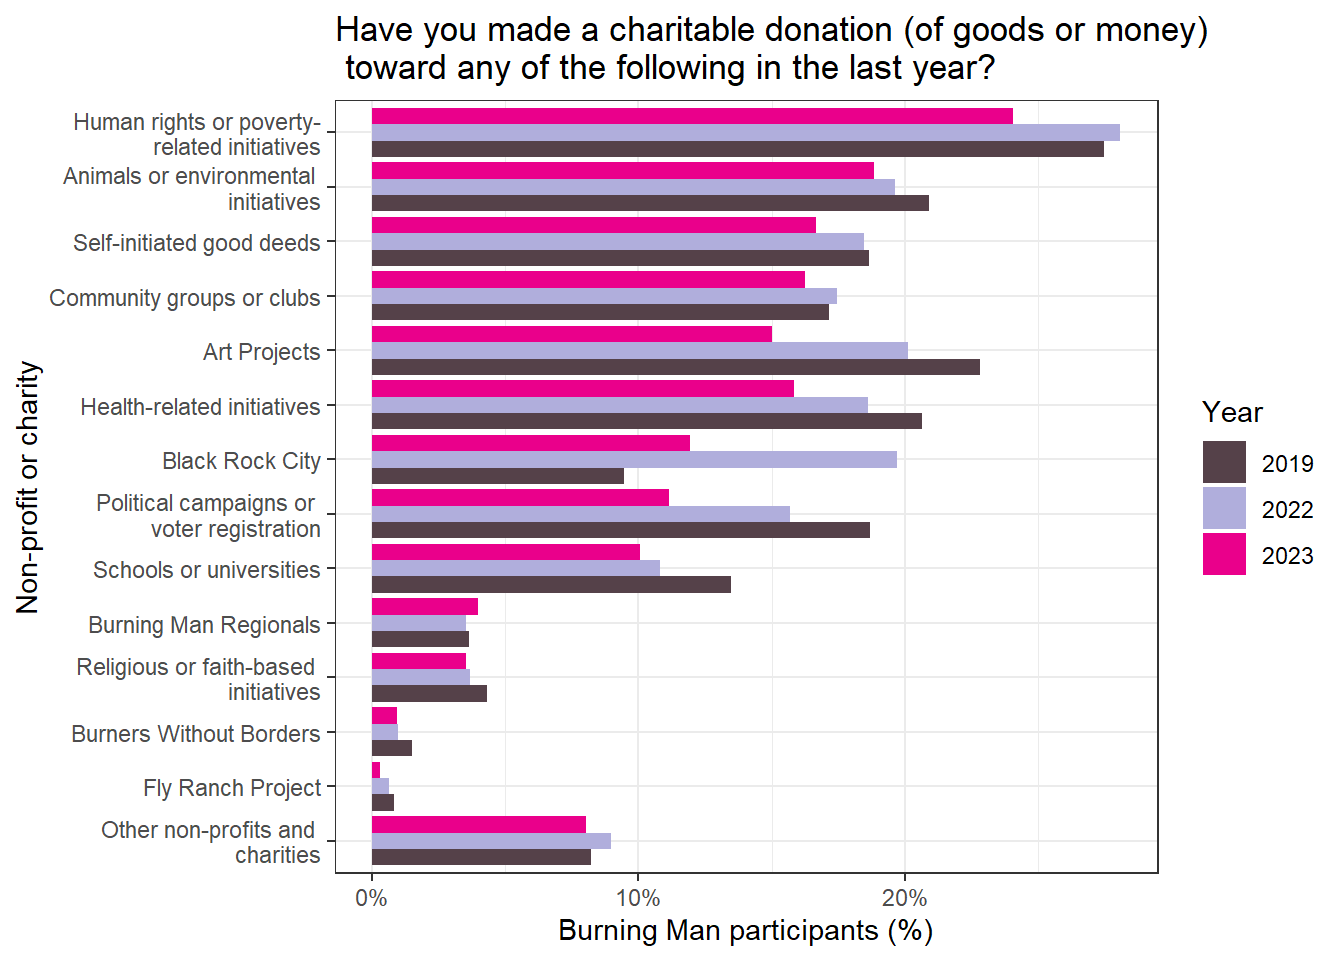
| 2019 | 2022 | 2023 | 2024 | 2025 | |
|---|---|---|---|---|---|
| Human rights initiatives | 27.5% (26.4%, 28.5%) | 28.1% (27.0%, 29.1%) | 23.3% (22.2%, 24.4%) | 18.4% (17.1%, 19.7%) | 33.1% (31.3%, 34.9%) |
| Self-initiated good deeds | 18.6% (17.7%, 19.6%) | 18.5% (17.6%, 19.4%) | 17.9% (17.0%, 18.9%) | 16.6% (15.4%, 18.0%) | 32.3% (30.5%, 34.2%) |
| Art projects | 22.8% (21.8%, 23.8%) | 20.1% (19.2%, 21.0%) | 16.9% (16.0%, 17.8%) | 14.6% (13.5%, 15.8%) | 30.6% (28.8%, 32.5%) |
| Animals or Environmental initiatives | 20.9% (20.0%, 21.9%) | 19.6% (18.7%, 20.6%) | 19.1% (18.1%, 20.1%) | 15.5% (14.3%, 16.7%) | 28.4% (26.7%, 30.2%) |
| Poverty-related initiatives | -- | -- | -- | 15.9% (14.7%, 17.2%) | 23.1% (21.5%, 24.7%) |
| Health-related initiatives | 20.6% (19.7%, 21.6%) | 18.6% (17.7%, 19.5%) | 16.1% (15.2%, 17.0%) | 12.8% (11.7%, 14.0%) | 22.7% (21.1%, 24.4%) |
| Community groups or Clubs | 17.2% (16.3%, 18.1%) | 17.4% (16.6%, 18.3%) | 17.6% (16.7%, 18.6%) | 14.2% (13.0%, 15.4%) | 21.6% (20.0%, 23.3%) |
| Political campaigns or Voter registration | 18.7% (17.8%, 19.6%) | 15.7% (14.9%, 16.5%) | 12.0% (11.2%, 12.8%) | 15.0% (13.9%, 16.1%) | 21.5% (20.0%, 23.1%) |
| Burning Man Project | 9.5% (8.8%, 10.2%) | 19.7% (18.8%, 20.6%) | 13.8% (13.0%, 14.7%) | 11.0% (10.0%, 12.1%) | 21.4% (19.7%, 23.1%) |
| Schools or Universities | 13.5% (12.7%, 14.3%) | 10.8% (10.1%, 11.5%) | 11.2% (10.4%, 12.0%) | 10.0% (9.1%, 11.1%) | 16.6% (15.2%, 18.1%) |
| Regional Burning Man events and communities | 3.6% (3.2%, 4.1%) | 3.5% (3.1%, 4.0%) | 4.3% (3.8%, 4.8%) | 3.6% (3.1%, 4.2%) | 8.5% (7.5%, 9.7%) |
| Religious or Faith-based initiatives | 4.3% (3.9%, 4.8%) | 3.7% (3.3%, 4.1%) | 4.3% (3.8%, 4.8%) | 4.3% (3.6%, 5.0%) | 6.4% (5.5%, 7.4%) |
| Burners Without Borders | 1.5% (1.2%, 1.8%) | 1.0% (0.8%, 1.2%) | 1.0% (0.8%, 1.3%) | 0.4% (0.3%, 0.6%) | 3.0% (2.4%, 3.9%) |
| Fly Ranch Project | 0.8% (0.6%, 1.1%) | 0.6% (0.5%, 0.8%) | 0.5% (0.4%, 0.7%) | 0.5% (0.3%, 0.8%) | 1.5% (1.0%, 2.2%) |
| Other nonprofits or charities | 8.2% (7.6%, 8.9%) | 9.0% (8.3%, 9.7%) | 8.4% (7.7%, 9.1%) | 8.2% (7.3%, 9.1%) | 11.1% (9.9%, 12.4%) |