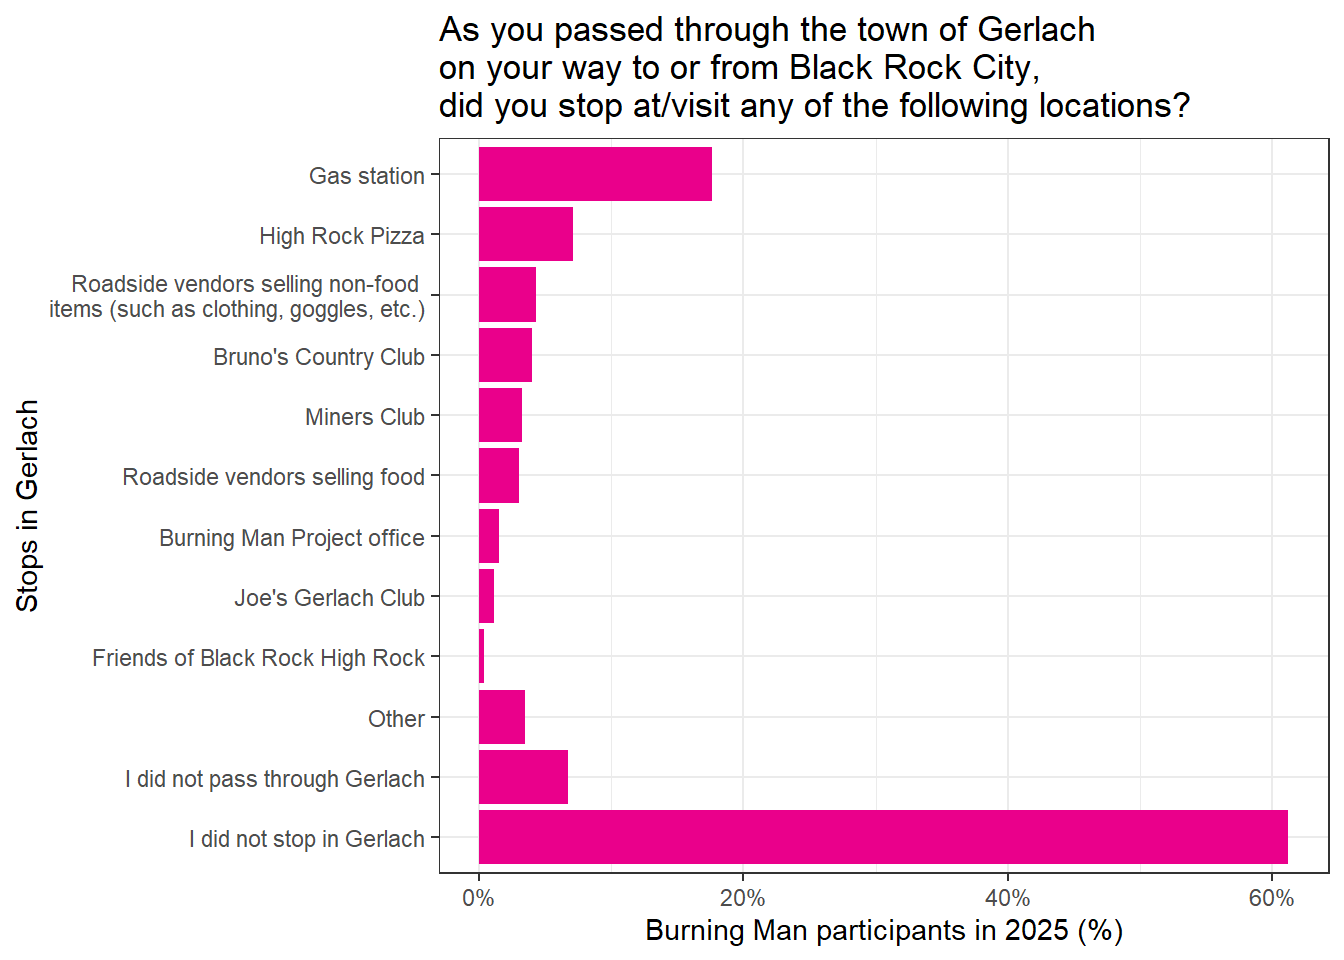
5  Travel and camp logistics

5.1 Travel to and from Black Rock City

5.1.1 Arrival date

2025
Before Wed 8/20 (pre-event) 8.6% (7.7%, 9.6%)
Wed 8/20 (pre-event) 5.7% (5.0%, 6.6%)
Thu 8/21 (pre-event) 10.7% (9.7%, 11.7%)
Fri 8/22 (pre-event) 15.3% (14.1%, 16.6%)
Sat 8/23 (pre-event) 14.8% (13.6%, 16.0%)
Sun 8/24 21.4% (20.0%, 22.8%)
Mon 8/25 10.6% (9.6%, 11.7%)
Tue 8/26 5.7% (5.0%, 6.6%)
Wed 8/27 4.5% (3.9%, 5.3%)
Thu 8/28 2.2% (1.7%, 2.9%)
Fri 8/29 0.3% (0.2%, 0.5%)
Sat 8/30 < 0.1% (--, --)
Sun 8/31 < 0.1% (--, --)
Mon 9/01 (post-event) < 0.1% (--, --)
Tue 9/02 (post-event) < 0.1% (--, --)
After Tuesday 9/02 (post-event) < 0.1% (--, --)

5.1.2 Departure date

2025
Before Sun 8/24 (pre-event) 0.5% (0.3%, 0.8%)
Sun 8/24 3.6% (2.9%, 4.3%)
Mon 8/25 5.3% (4.5%, 6.1%)
Tue 8/26 1.9% (1.6%, 2.4%)
Wed 8/27 0.7% (0.4%, 1.1%)
Thu 8/28 0.7% (0.5%, 1.1%)
Fri 8/29 2.0% (1.6%, 2.5%)
Sat 8/30 8.2% (7.3%, 9.1%)
Sun 8/31 28.9% (27.4%, 30.5%)
Mon 9/01 (post-event) 31.3% (29.7%, 32.9%)
Tue 9/02 (post-event) 12.9% (11.8%, 14.0%)
Wed 9/03 (post-event) 2.2% (1.8%, 2.7%)
Thu 9/04 (post-event) 0.6% (0.4%, 1.0%)
After Thu 9/04 (post-event) 1.3% (1.0%, 1.8%)

5.1.3 Point of entry

2015 2016 2017 2018 2019 2022 2023 2024 2025
Gate in a vehicle 91.7% (91.0%, 92.3%) 89.6% (88.8%, 90.5%) 86.9% (86.0%, 87.8%) 87.0% (86.1%, 87.8%) 85.2% (84.3%, 86.1%) 85.8% (85.0%, 86.7%) 84.3% (83.2%, 85.2%) 85.3% (84.0%, 86.6%) 85.0% (83.8%, 86.2%)
Gate in a Burner Express Bus 5.7% (5.1%, 6.3%) 7.5% (6.8%, 8.2%) 9.8% (9.1%, 10.6%) 9.7% (9.0%, 10.5%) 11.0% (10.2%, 11.8%) 10.3% (9.6%, 11.1%) 11.9% (11.1%, 12.9%) 10.7% (9.6%, 11.9%) 10.8% (9.8%, 11.9%)
Point 1 1.2% (1.0%, 1.5%) 0.9% (0.8%, 1.2%) 1.2% (1.0%, 1.4%) 1.7% (1.4%, 2.0%) 2.2% (1.8%, 2.6%) 2.7% (2.4%, 3.1%) 2.6% (2.3%, 3.1%) 2.6% (2.1%, 3.1%) 3.2% (2.6%, 3.8%)
BRC airport 0.8% (0.6%, 1.1%) 1.1% (0.8%, 1.5%) 1.4% (1.2%, 1.8%) 1.1% (0.8%, 1.3%) 1.1% (0.8%, 1.4%) 0.8% (0.6%, 1.0%) 0.7% (0.5%, 0.9%) 0.9% (0.6%, 1.4%) 0.7% (0.5%, 0.9%)
Gate with another shuttle service 0.3% (0.2%, 0.4%) 0.6% (0.4%, 0.9%) 0.3% (0.2%, 0.5%) 0.3% (0.2%, 0.4%) 0.4% (0.2%, 0.6%) 0.1% (0.1%, 0.3%) 0.2% (0.1%, 0.4%) 0.2% (0.1%, 0.4%) 0.2% (0.1%, 0.5%)
Other 0.3% (0.2%, 0.4%) 0.2% (0.1%, 0.5%) 0.4% (0.2%, 0.6%) 0.3% (0.2%, 0.5%) 0.2% (0.1%, 0.4%) 0.2% (0.1%, 0.4%) 0.3% (0.1%, 0.5%) 0.3% (0.2%, 0.5%) 0.2% (0.1%, 0.4%)

5.1.4 Did you stop at any locations in Gerlach?

2025
Gas station 17.7% (16.3%, 19.0%)
High Rock Pizza 7.1% (6.2%, 8.1%)
Roadside vendors selling non-food items (such as clothing, goggles, etc.) 4.3% (3.6%, 5.1%)
Bruno's Country Club 4.0% (3.4%, 4.8%)
Miners Club 3.2% (2.6%, 3.9%)
Roadside vendors selling food 3.0% (2.4%, 3.8%)
Burning Man Project office 1.5% (1.1%, 2.0%)
Joe's Gerlach Club 1.2% (0.8%, 1.7%)
Friends of Black Rock High Rock 0.3% (0.2%, 0.7%)
Other 3.5% (2.9%, 4.2%)
I did not pass through Gerlach 6.7% (5.9%, 7.6%)
I did not stop in Gerlach 61.2% (59.5%, 62.9%)

5.1.5 Spending in Nevada

Percentile 2025
1% $0 ($0, $38)
10% $50 ($50, $75)
25% $200 ($200, $250)
50% $400 ($400, $500)
75% $1000 ($1000, $1250)
90% $2000 ($2000, $2500)
99% $7500 ($6500, $10000)

5.1.6 Spending to travel to Burning Man

Percentile 2025
1% $100 ($100, $150)
10% $500 ($500, $600)
25% $1000 ($1000, $1200)
50% $2000 ($2000, $2400)
75% $3200 ($3000, $3500)
90% $5200 ($5000, $6000)
99% $17000 ($15000, $25000)

5.2 Camp Logistics

5.2.1 Camps placed by the Burning Man Placement Team

2014 2015 2016 2017 2018 2019 2022 2023 2024 2025
No 31.4% (30.5%, 32.3%) 31.6% (30.5%, 32.8%) 29.4% (28.1%, 30.7%) 24.3% (23.1%, 25.4%) 22.9% (21.8%, 24.0%) 16.5% (15.6%, 17.5%) 13.0% (12.2%, 13.9%) 16.7% (15.7%, 17.7%) 22.0% (20.5%, 23.5%) 21.8% (20.4%, 23.2%)
I don't know 4.6% (4.2%, 5.0%) 5.2% (4.7%, 5.8%) 6.0% (5.3%, 6.7%) 5.2% (4.6%, 5.9%) 4.4% (3.9%, 5.0%) 3.5% (3.0%, 4.0%) 3.8% (3.4%, 4.4%) 4.8% (4.2%, 5.5%) 4.8% (4.0%, 5.8%) 3.9% (3.3%, 4.7%)
Yes 64.0% (63.0%, 64.9%) 63.1% (62.0%, 64.3%) 64.7% (63.3%, 66.0%) 70.6% (69.3%, 71.7%) 72.7% (71.6%, 73.9%) 80.0% (78.9%, 81.0%) 83.1% (82.2%, 84.0%) 78.5% (77.3%, 79.6%) 73.2% (71.6%, 74.9%) 74.3% (72.8%, 75.8%)

5.2.2 Bikes

2025
Yes, a regular bike 74.7% (73.2%, 76.2%)
Yes, an e-bike 21.1% (19.7%, 22.6%)
No 4.1% (3.5%, 4.8%)