5  Travel logistics

5.1 Arrival and departure

5.1.1 Arrival date

2024
Before Wed 8/21 (pre-event) 7.0% (6.3%, 7.9%)
Wed 8/21 (pre-event) 6.0% (5.3%, 6.8%)
Thu 8/22 (pre-event) 10.1% (9.1%, 11.1%)
Fri 8/23 (pre-event) 13.4% (12.3%, 14.6%)
Sat 8/24 (pre-event) 15.0% (13.8%, 16.3%)
Sun 8/25 28.0% (26.4%, 29.7%)
Mon 8/26 7.7% (6.8%, 8.7%)
Tue 8/27 5.2% (4.5%, 6.1%)
Wed 8/28 4.4% (3.7%, 5.2%)
Thu 8/29 2.1% (1.6%, 2.8%)
Fri 8/30 0.7% (0.5%, 1.0%)
Sat 8/31 < 0.1% (--, --)
Sun 9/01 < 0.1% (--, --)
Mon 9/02 0.1% (0.0%, 0.4%)
Tue 9/03 (post-event) < 0.1% (--, --)
After Tue 9/03 (post-event) < 0.1% (--, --)

5.1.2 Point of entry

2015 2016 2017 2018 2019 2022 2023 2024
Gate in a vehicle 91.7% (91.0%, 92.3%) 89.6% (88.8%, 90.5%) 86.9% (86.0%, 87.8%) 87.0% (86.1%, 87.8%) 85.2% (84.3%, 86.1%) 85.8% (85.0%, 86.7%) 84.3% (83.2%, 85.2%) 85.3% (84.0%, 86.6%)
Gate in a Burner Express Bus 5.7% (5.1%, 6.3%) 7.5% (6.8%, 8.2%) 9.8% (9.1%, 10.6%) 9.7% (9.0%, 10.5%) 11.0% (10.2%, 11.8%) 10.3% (9.6%, 11.1%) 11.9% (11.1%, 12.9%) 10.7% (9.6%, 11.9%)
Point 1 1.2% (1.0%, 1.5%) 0.9% (0.8%, 1.2%) 1.2% (1.0%, 1.4%) 1.7% (1.4%, 2.0%) 2.2% (1.8%, 2.6%) 2.7% (2.4%, 3.1%) 2.6% (2.3%, 3.1%) 2.6% (2.1%, 3.1%)
BRC airport 0.8% (0.6%, 1.1%) 1.1% (0.8%, 1.5%) 1.4% (1.2%, 1.8%) 1.1% (0.8%, 1.3%) 1.1% (0.8%, 1.4%) 0.8% (0.6%, 1.0%) 0.7% (0.5%, 0.9%) 0.9% (0.6%, 1.4%)
Gate with another shuttle service 0.3% (0.2%, 0.4%) 0.6% (0.4%, 0.9%) 0.3% (0.2%, 0.5%) 0.3% (0.2%, 0.4%) 0.4% (0.2%, 0.6%) 0.1% (0.1%, 0.3%) 0.2% (0.1%, 0.4%) 0.2% (0.1%, 0.4%)
Other 0.3% (0.2%, 0.4%) 0.2% (0.1%, 0.5%) 0.4% (0.2%, 0.6%) 0.3% (0.2%, 0.5%) 0.2% (0.1%, 0.4%) 0.2% (0.1%, 0.4%) 0.3% (0.1%, 0.5%) 0.3% (0.2%, 0.5%)

5.1.3 Departure date

2024 (planned) 2024 (actual)
Before Sun 8/25 (pre-event) 0.5% (0.3%, 0.9%) 0.7% (0.4%, 1.2%)
Sun 8/25 4.8% (4.1%, 5.6%) 5.8% (5.0%, 6.7%)
Mon 8/26 7.5% (6.6%, 8.5%) 7.3% (6.5%, 8.3%)
Tue 8/27 3.7% (3.2%, 4.4%) 3.5% (2.9%, 4.1%)
Wed 8/28 0.6% (0.4%, 1.0%) 0.5% (0.3%, 0.9%)
Thu 8/29 0.9% (0.7%, 1.4%) 1.0% (0.7%, 1.3%)
Fri 8/30 2.0% (1.6%, 2.5%) 2.4% (1.9%, 3.1%)
Sat 8/31 6.5% (5.7%, 7.4%) 7.8% (6.9%, 8.8%)
Sun 9/01 21.9% (20.5%, 23.5%) 27.0% (25.4%, 28.7%)
Mon 9/02 32.4% (30.7%, 34.0%) 29.2% (27.7%, 30.8%)
Tue 9/03 (post-event) 15.4% (14.2%, 16.7%) 11.7% (10.7%, 12.8%)
After Tue 9/03 (post-event) 3.7% (3.1%, 4.3%) 3.0% (2.6%, 3.6%)

5.1.4 Departure delay

5.1.5 Point of departure

2018 2019 2022 2023 2024
Gate in the same vehicle 78.0% (77.0%, 79.0%) 76.6% (75.5%, 77.6%) 76.7% (75.7%, 77.7%) 75.4% (74.3%, 76.5%) 78.2% (76.7%, 79.7%)
Gate in a different vehicle 10.1% (9.4%, 10.9%) 10.3% (9.6%, 11.1%) 11.3% (10.5%, 12.1%) 11.0% (10.2%, 11.9%) 8.3% (7.4%, 9.4%)
Gate in a Burner Express Bus 8.3% (7.7%, 9.0%) 9.3% (8.5%, 10.0%) 7.9% (7.3%, 8.6%) 7.6% (6.9%, 8.4%) 9.5% (8.5%, 10.6%)
Point 1 2.0% (1.7%, 2.3%) 2.3% (1.9%, 2.7%) 2.8% (2.5%, 3.2%) 3.1% (2.7%, 3.6%) 2.4% (1.9%, 2.9%)
BRC airport 1.0% (0.8%, 1.2%) 0.9% (0.7%, 1.2%) 0.6% (0.5%, 0.9%) 0.5% (0.3%, 0.7%) 1.1% (0.7%, 1.6%)
Gate with another shuttle service 0.3% (0.2%, 0.5%) 0.5% (0.3%, 0.7%) 0.1% (0.1%, 0.2%) 0.3% (0.2%, 0.6%) 0.1% (0.1%, 0.3%)
Other 0.3% (0.2%, 0.4%) 0.2% (0.1%, 0.4%) 0.5% (0.3%, 0.6%) 2.0% (1.7%, 2.5%) 0.4% (0.2%, 0.6%)

5.2 Flying to Black Rock City

5.2.1 Flew in an airplane to get (at least part of the way) to Black Rock City this year?

2014 2015 2016 2017 2018 2019 2022 2023 2024
Flew (at least partway) to Black Rock City 27.5% (26.6%, 28.4%) 32.3% (31.2%, 33.4%) 34.4% (33.0%, 35.7%) 35.9% (34.7%, 37.2%) 28.8% (27.7%, 29.9%) 30.0% (28.8%, 31.2%) 26.1% (25.0%, 27.2%) 25.9% (24.7%, 27.1%) 25.1% (23.6%, 26.8%)

5.2.2 If you flew, what was your final arrival airport?

2014 2015 2016 2017 2018 2019 2022 2023 2024
Reno 35.4% (33.7%, 37.2%) 39.6% (37.6%, 41.6%) 39.0% (36.6%, 41.4%) 36.5% (34.4%, 38.6%) 39.4% (37.1%, 41.6%) 41.9% (39.6%, 44.2%) 48.2% (45.8%, 50.6%) 48.9% (46.3%, 51.6%) 45.9% (42.4%, 49.5%)
San Francisco 33.3% (31.5%, 35.0%) 28.8% (27.0%, 30.7%) 32.7% (30.3%, 35.1%) 33.0% (30.8%, 35.3%) 29.5% (27.3%, 31.7%) 27.6% (25.5%, 29.7%) 22.4% (20.4%, 24.5%) 23.5% (21.2%, 25.8%) 24.8% (21.6%, 28.2%)
Salt Lake City 1.3% (0.9%, 1.8%) 1.5% (1.1%, 2.1%) 1.6% (1.2%, 2.3%) 2.0% (1.5%, 2.8%) 2.0% (1.5%, 2.9%) 2.3% (1.7%, 3.1%) 7.4% (6.2%, 8.7%) 8.1% (6.8%, 9.8%) 5.8% (4.4%, 7.6%)
Los Angeles 9.4% (8.4%, 10.5%) 10.9% (9.7%, 12.3%) 7.0% (5.8%, 8.6%) 8.3% (7.1%, 9.7%) 6.8% (5.6%, 8.2%) 7.6% (6.5%, 8.9%) 5.7% (4.7%, 7.0%) 5.7% (4.5%, 7.2%) 6.3% (4.6%, 8.6%)
Sacramento 3.7% (3.1%, 4.5%) 3.6% (2.9%, 4.5%) 3.2% (2.5%, 4.1%) 3.2% (2.5%, 4.1%) 4.5% (3.7%, 5.6%) 6.1% (5.0%, 7.4%) 5.1% (4.2%, 6.3%) 4.7% (3.7%, 5.8%) 5.1% (3.8%, 6.7%)
BRC (88NV) 3.2% (2.6%, 4.0%) 2.7% (2.1%, 3.4%) 3.3% (2.5%, 4.3%) 4.0% (3.2%, 4.9%) 3.7% (2.9%, 4.6%) 3.5% (2.7%, 4.5%) 2.8% (2.2%, 3.7%) 2.7% (2.0%, 3.5%) 3.6% (2.4%, 5.3%)
Other 13.7% (12.5%, 15.0%) 12.9% (11.6%, 14.3%) 13.2% (11.6%, 15.0%) 13.0% (11.5%, 14.6%) 14.1% (12.5%, 15.9%) 11.0% (9.5%, 12.5%) 8.3% (7.1%, 9.8%) 6.4% (5.2%, 7.8%) 8.5% (6.6%, 10.9%)

5.3 Vehicle logistics

5.3.1 How many people were in your vehicle when you arrived at the Gate?

2013 2014 2015 2016 2017 2018 2019 2022 2023 2024
1 11.9% (11.3%, 12.5%) 12.8% (12.1%, 13.5%) 9.1% (8.6%, 9.8%) 10.5% (9.7%, 11.3%) 12.0% (11.2%, 12.7%) 13.5% (12.7%, 14.3%) 13.9% (13.0%, 14.8%) 17.5% (16.7%, 18.5%) 19.7% (18.6%, 20.8%) 19.2% (17.8%, 20.6%)
2 41.3% (40.3%, 42.3%) 44.6% (43.6%, 45.6%) 36.5% (35.5%, 37.5%) 40.1% (38.8%, 41.4%) 41.9% (40.7%, 43.1%) 43.6% (42.4%, 44.9%) 43.2% (42.0%, 44.5%) 51.3% (50.1%, 52.6%) 50.2% (48.8%, 51.7%) 51.5% (49.6%, 53.3%)
3 18.7% (18.0%, 19.5%) 19.8% (19.1%, 20.7%) 15.3% (14.6%, 16.1%) 17.2% (16.2%, 18.3%) 16.5% (15.6%, 17.5%) 15.2% (14.4%, 16.1%) 15.2% (14.3%, 16.1%) 16.7% (15.7%, 17.7%) 15.7% (14.7%, 16.8%) 16.7% (15.3%, 18.2%)
4 13.2% (12.5%, 13.9%) 11.8% (11.2%, 12.4%) 10.3% (9.7%, 11.0%) 11.1% (10.2%, 12.0%) 9.3% (8.6%, 10.1%) 9.3% (8.6%, 10.1%) 8.8% (8.2%, 9.6%) 8.7% (8.0%, 9.4%) 8.8% (8.0%, 9.7%) 7.8% (6.8%, 9.0%)
5 5.6% (5.1%, 6.1%) 5.3% (4.9%, 5.8%) 4.9% (4.5%, 5.4%) 4.4% (3.9%, 5.1%) 3.7% (3.3%, 4.3%) 3.6% (3.1%, 4.1%) 3.2% (2.8%, 3.7%) 3.7% (3.2%, 4.2%) 3.4% (2.9%, 4.0%) 2.9% (2.3%, 3.7%)
6-7 4.7% (4.3%, 5.2%) 4.1% (3.8%, 4.6%) 2.9% (2.5%, 3.2%) 2.8% (2.3%, 3.3%) 3.0% (2.5%, 3.5%) 1.9% (1.6%, 2.3%) 1.8% (1.5%, 2.2%) 1.7% (1.4%, 2.0%) 1.6% (1.3%, 2.0%) 1.5% (1.1%, 2.1%)
8-9 1.4% (1.1%, 1.6%) 1.0% (0.8%, 1.2%) 0.8% (0.6%, 1.1%) 0.9% (0.6%, 1.2%) 0.4% (0.3%, 0.6%) 0.5% (0.4%, 0.8%) 0.6% (0.4%, 0.8%) 0.2% (0.1%, 0.4%) 0.4% (0.2%, 0.7%) 0.1% (0.1%, 0.3%)
10-19 1.0% (0.8%, 1.3%) 0.5% (0.4%, 0.7%) 0.6% (0.4%, 0.7%) 0.5% (0.3%, 0.7%) 0.6% (0.4%, 0.9%) 0.8% (0.6%, 1.0%) 0.3% (0.2%, 0.4%) 0.2% (0.1%, 0.3%) < 0.1% (--, --) < 0.1% (--, --)
20 or more 2.2% (1.9%, 2.6%) < 0.1% (--, --) 0.1% (0.1%, 0.2%) 0.9% (0.7%, 1.2%) 0.4% (0.3%, 0.6%) < 0.1% (--, --) 0.3% (0.1%, 0.5%) < 0.1% (--, --) < 0.1% (--, --) < 0.1% (--, --)

5.3.2 Vehicle passengers under 18 years old

2013 2014 2015 2016 2017 2018 2019 2022 2023 2024
At least one person under 13 years old in car 1.3% (1.0%, 1.6%) 1.3% (1.1%, 1.5%) 0.8% (0.6%, 1.0%) 1.1% (0.9%, 1.5%) 1.2% (1.0%, 1.5%) 1.3% (1.0%, 1.6%) 1.5% (1.2%, 1.8%) 1.8% (1.5%, 2.2%) 2.1% (1.7%, 2.5%) 1.9% (1.4%, 2.4%)
At least one person 13 to 17 years old in car 1.2% (0.9%, 1.6%) 0.7% (0.6%, 1.0%) 0.4% (0.2%, 0.7%) 0.9% (0.6%, 1.5%) 0.7% (0.4%, 1.0%) 0.7% (0.5%, 1.0%) 0.3% (0.2%, 0.5%) 0.6% (0.4%, 0.8%) 0.6% (0.4%, 0.9%) 0.4% (0.2%, 0.8%)

5.3.3 Vehicle type

2022 2023 2024
Pick-up truck 21.7% (20.7%, 22.8%) 23.6% (22.4%, 24.8%) 22.9% (21.4%, 24.5%)
Moving truck or box truck 20.3% (19.3%, 21.4%) 18.8% (17.7%, 19.9%) 18.9% (17.5%, 20.4%)
SUV 17.9% (16.9%, 18.8%) 19.4% (18.3%, 20.6%) 21.0% (19.5%, 22.6%)
Car 17.3% (16.4%, 18.3%) 15.8% (14.8%, 16.9%) 16.1% (14.8%, 17.6%)
Bus 8.3% (7.6%, 9.0%) 8.0% (7.3%, 8.8%) 7.7% (6.8%, 8.6%)
RV 5.1% (4.6%, 5.7%) 5.2% (4.7%, 5.9%) 5.2% (4.4%, 6.0%)
Semi-truck towing trailer 1.4% (1.1%, 1.7%) 1.2% (1.0%, 1.5%) 1.5% (1.1%, 2.0%)
Full-size van 1.3% (1.1%, 1.6%) 1.2% (0.9%, 1.5%) 1.0% (0.7%, 1.5%)
Mini-van 0.6% (0.5%, 0.9%) 0.8% (0.6%, 1.1%) 0.5% (0.3%, 0.8%)
Motorcycle < 0.1% (--, --) < 0.1% (--, --) < 0.1% (--, --)
Other 6.0% (5.4%, 6.6%) 6.0% (5.3%, 6.7%) 5.2% (4.4%, 6.0%)

5.3.4 Towing a trailer

2022 2023 2024
No trailer 74.0% (72.9%, 75.1%) 73.0% (71.8%, 74.2%) 74.0% (72.4%, 75.5%)
Small 2.8% (2.4%, 3.3%) 3.0% (2.5%, 3.4%) 2.8% (2.3%, 3.5%)
Medium 7.0% (6.4%, 7.7%) 7.6% (6.9%, 8.4%) 7.6% (6.7%, 8.6%)
Large 9.5% (8.8%, 10.2%) 9.4% (8.6%, 10.2%) 9.3% (8.3%, 10.4%)
Very large < 0.1% (--, --) < 0.1% (--, --) < 0.1% (--, --)
I don't remember 6.5% (6.0%, 7.1%) 7.0% (6.3%, 7.7%) 6.3% (5.5%, 7.2%)

5.3.5 Vehicle fuel type

2022 2023 2024
Regular gasoline 81.6% (80.6%, 82.5%) 81.9% (80.8%, 83.0%) 81.5% (80.0%, 82.9%)
Premium gasoline 4.8% (4.3%, 5.3%) 5.0% (4.4%, 5.6%) 4.7% (4.0%, 5.6%)
Diesel 11.5% (10.7%, 12.3%) 11.1% (10.2%, 12.0%) 11.2% (10.2%, 12.4%)
Bio-diesel or other bio-fuel 0.2% (0.1%, 0.3%) 0.2% (0.1%, 0.3%) 0.3% (0.1%, 0.5%)
Battery powered 0.2% (0.1%, 0.4%) 0.3% (0.2%, 0.4%) 0.7% (0.4%, 1.2%)
I don't know 1.7% (1.4%, 2.1%) 1.5% (1.2%, 1.9%) 1.6% (1.1%, 2.2%)

5.3.6 Vehicle MPG on the way to Black Rock City

2019 2022 2023 2024
Mean (Miles per gallon) 19.0 (18.6, 19.3) 18.8 (18.5, 19.1) 18.8 (18.5, 19.2)
25^th^ percentile 12 (12, 13) 12 (12, 13) 12 (12, 13)
Median 18 (18, 19) 17 (17, 18) 17 (17, 18)
75^th^ percentile 25 (25, 26) 24 (24, 25) 24 (24, 25)

5.4 Route to BRC

5.4.1 How many total miles did you drive to get to Black Rock City?

2015 2016 2017 2018 2019 2022 2023 2024
Mean (Miles) 1170.1 (1144.5, 1195.6) 1205.7 (1169.7, 1241.6) 1214.2 (1181.2, 1247.2) 1281.1 (1238.3, 1324.0) 1145.9 (1118.6, 1173.3) 1191.6 (1163.9, 1219.2) 1209.7 (1178.1, 1241.3) 1064.7 (1030.1, 1099.4)
25^th^ percentile 680 (680, 700) 680 (680, 700) 680 (680, 700) 680 (680, 700) 680 (680, 700) 680 (680, 700) 680 (680, 700) 582 (510, 628)
Median 800 (800, 900) 800 (800, 930) 800 (800, 900) 900 (800, 998) 770 (750, 800) 900 (850, 998) 998 (998, 1000) 700 (700, 750)
75^th^ percentil 1342 (1342, 1360) 1342 (1342, 1400) 1342 (1342, 1400) 1342 (1342, 1400) 1339.2 (1300, 1342) 1342 (1342, 1400) 1342 (1342, 1400) 1342 (1342, 1400)

5.4.2 Route through Nevada to Black Rock City

2019 2022 2023 2024
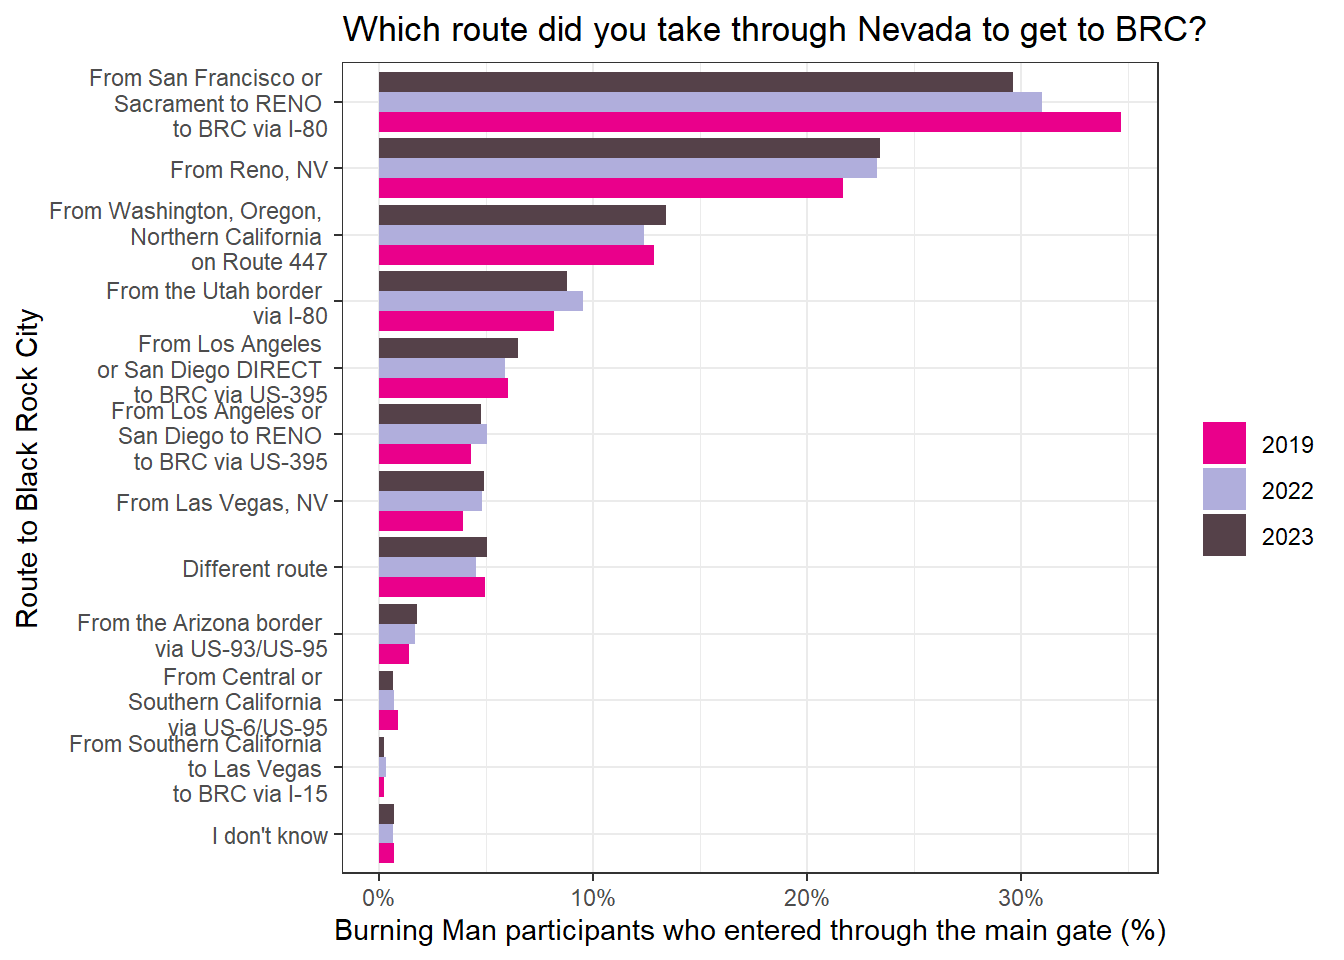
From San Francisco or Sacrament to RENO to BRC via I-80 34.7% (33.4%, 36.0%) 31.0% (29.8%, 32.2%) 28.7% (27.4%, 30.0%) 33.0% (31.3%, 34.8%)
From Reno, NV 21.7% (20.6%, 22.8%) 23.3% (22.2%, 24.3%) 23.6% (22.4%, 24.8%) 27.2% (25.6%, 29.0%)
From Washington, Oregon, Northern California on Route 447 12.8% (12.0%, 13.8%) 12.4% (11.6%, 13.2%) 13.3% (12.4%, 14.3%) 9.1% (8.2%, 10.1%)
From the Utah border via I-80 8.2% (7.5%, 9.0%) 9.6% (8.8%, 10.3%) 9.5% (8.7%, 10.3%) 8.3% (7.4%, 9.3%)
From Los Angeles or San Diego DIRECT to BRC via US-395 6.0% (5.4%, 6.7%) 5.9% (5.3%, 6.6%) 6.5% (5.8%, 7.2%) 7.2% (6.2%, 8.3%)
From Los Angeles or San Diego to RENO to BRC via US-395 4.3% (3.8%, 4.9%) 5.0% (4.5%, 5.6%) 4.3% (3.8%, 5.0%) 3.7% (3.1%, 4.5%)
From Las Vegas, NV 3.9% (3.4%, 4.5%) 4.8% (4.3%, 5.4%) 4.9% (4.3%, 5.5%) 4.2% (3.5%, 5.1%)
Different route 5.0% (4.4%, 5.6%) 4.6% (4.1%, 5.1%) 5.6% (5.0%, 6.3%) 4.2% (3.6%, 5.0%)
From the Arizona border via US-93/US-95 1.4% (1.1%, 1.8%) 1.7% (1.4%, 2.0%) 2.0% (1.7%, 2.4%) 1.3% (1.0%, 1.8%)
From Central or Southern California via US-6/US-95 0.9% (0.7%, 1.2%) 0.7% (0.5%, 0.9%) 0.7% (0.5%, 1.0%) 0.8% (0.5%, 1.2%)
From Southern California to Las Vegas to BRC via I-15 0.2% (0.1%, 0.4%) 0.3% (0.2%, 0.5%) 0.3% (0.1%, 0.5%) 0.2% (0.1%, 0.5%)
I don't know 0.7% (0.5%, 1.0%) 0.7% (0.5%, 1.0%) 0.6% (0.4%, 0.9%) 0.7% (0.4%, 1.1%)

5.5 Visiting Nevada

5.5.1 Did you stop at any locations in Gerlach?

2024
Roadside vendors (non-food) 7.8% (6.8%, 9.0%)
High Rock Pizza 7.7% (6.8%, 8.8%)
Roadside vendors (food) 4.7% (3.9%, 5.6%)
Bruno's Country Club 4.1% (3.5%, 4.8%)
The Gerlach Burning Man Project office 2.8% (2.3%, 3.3%)
Miners Club 2.0% (1.6%, 2.6%)
Joe's Gerlach Club 0.7% (0.4%, 1.1%)
Friends of Black Rock City 0.4% (0.3%, 0.7%)
The Oasis < 0.1% (--, --)
The Desert Club (Hotel) < 0.1% (--, --)
The 360 < 0.1% (--, --)
Granite Point RV Park < 0.1% (--, --)
Other 4.1% (3.4%, 4.9%)
I did not stop 58.4% (56.5%, 60.3%)

5.5.2 Visiting parks or recreation areas

2015 2016 2017 2018 2019 2022 2023 2024
Yes, one place 16.9% (16.0%, 17.8%) 15.7% (14.7%, 16.8%) 16.8% (15.9%, 17.9%) 14.9% (14.1%, 15.8%) 16.8% (15.8%, 17.8%) 13.6% (12.7%, 14.4%) 12.5% (11.6%, 13.4%) 14.2% (13.0%, 15.5%)
Yes, more than one place 10.2% (9.5%, 11.0%) 9.0% (8.2%, 9.9%) 10.4% (9.6%, 11.2%) 9.0% (8.3%, 9.7%) 9.1% (8.4%, 9.9%) 6.6% (6.1%, 7.3%) 7.3% (6.6%, 8.0%) 6.4% (5.5%, 7.4%)
No 71.1% (70.0%, 72.2%) 73.5% (72.2%, 74.8%) 71.3% (70.1%, 72.4%) 74.9% (73.8%, 76.0%) 72.8% (71.7%, 73.9%) 77.4% (76.4%, 78.4%) 77.1% (76.0%, 78.3%) 76.6% (75.0%, 78.1%)
Not sure 1.8% (1.5%, 2.2%) 1.8% (1.4%, 2.2%) 1.5% (1.2%, 1.9%) 1.2% (0.9%, 1.5%) 1.3% (1.0%, 1.6%) 2.4% (2.0%, 2.8%) 3.1% (2.6%, 3.6%) 2.8% (2.2%, 3.6%)

5.5.3 Reasons for visiting public lands

2017 2018 2019 2022 2023 2024
Burning Man only 86.3% (85.0%, 87.4%) 89.8% (88.9%, 90.7%) 87.9% (86.9%, 88.9%) 63.8% (62.7%, 65.0%) 62.9% (61.7%, 64.2%) 89.1% (87.7%, 90.4%)
Camping 5.8% (5.0%, 6.6%) 4.4% (3.8%, 5.1%) 4.3% (3.7%, 5.0%) 2.7% (2.3%, 3.1%) 3.2% (2.7%, 3.7%) 4.6% (3.8%, 5.6%)
Boating or swimming 3.7% (3.1%, 4.3%) 2.9% (2.4%, 3.4%) 3.9% (3.3%, 4.5%) 2.0% (1.7%, 2.3%) 1.4% (1.1%, 1.8%) 2.5% (1.9%, 3.4%)
Hotsprings 4.3% (3.7%, 5.0%) 3.1% (2.7%, 3.7%) 3.4% (2.9%, 4.1%) 1.8% (1.5%, 2.1%) 1.8% (1.5%, 2.2%) 2.5% (2.0%, 3.2%)
Hiking 4.4% (3.7%, 5.2%) 2.7% (2.3%, 3.3%) 3.9% (3.3%, 4.6%) 1.3% (1.0%, 1.6%) 1.5% (1.2%, 1.9%) 2.6% (2.0%, 3.5%)
Wind sailing 0.1% (0.0%, 0.3%) < 0.1% (--, --) < 0.1% (--, --) < 0.1% (--, --) 0.1% (0.0%, 0.3%) < 0.1% (--, --)
Other 2.2% (1.8%, 2.7%) 1.6% (1.3%, 2.0%) 1.5% (1.2%, 1.9%) 1.1% (0.9%, 1.4%) 1.1% (0.9%, 1.4%) 1.6% (1.2%, 2.3%)

5.5.4 Most visited Nevada cities or communities going to or from the Burning Man Event

5.5.5 Return to the Black Rock Desert

2017 2018 2019 2022 2023 2024
No 45.1% (43.7%, 46.6%) 46.4% (45.1%, 47.6%) 45.6% (44.4%, 46.9%) 49.0% (47.8%, 50.2%) 50.4% (49.1%, 51.7%) 52.5% (50.8%, 54.3%)
Maybe 37.7% (36.3%, 39.1%) 36.1% (34.9%, 37.4%) 35.6% (34.4%, 36.8%) 31.8% (30.7%, 32.9%) 31.3% (30.1%, 32.5%) 30.2% (28.6%, 31.8%)
Yes 17.1% (16.1%, 18.2%) 17.5% (16.6%, 18.5%) 18.8% (17.8%, 19.8%) 19.2% (18.3%, 20.2%) 18.3% (17.4%, 19.3%) 17.3% (16.0%, 18.6%)

5.6 Expenses

5.6.1 How much did you spend this year to travel to and from Black Rock City (not including your ticket)?

2015 2016 2017 2018 2019 2022 2023 2024
1% $150 ( $150, $200) $130 ( $100, $200) $150 ( $100, $200) $200 ( $200, $250) $200 ( $200, $250) $250 ( $200, $300) $120 ( $100, $150) $75 ( $35, $112)
10% $500 ( $500, $600) $500 ( $500, $600) $500 ( $500, $600) $500 ( $500, $600) $550 ( $500, $600) $800 ( $800, $900) $600 ( $600, $700) $500 ( $500, $600)
25% $800 ( $800, $900) $900 ( $900, $1000) $1000 ( $1000, $1200) $1000 ( $1000, $1150) $1000 ( $1000, $1200) $1300 ( $1200, $1500) $1000 ( $1000, $1200) $1000 ( $1000, $1200)
50% (median) $1500 ( $1500, $1700) $1500 ( $1500, $1700) $1500 ( $1500, $1700) $1500 ( $1500, $1655) $1600 ( $1500, $1800) $2000 ( $2000, $2300) $2000 ( $2000, $2300) $2000 ( $2000, $2400)
75% $2500 ( $2500, $3000) $2500 ( $2500, $3000) $2500 ( $2500, $3000) $2500 ( $2500, $3000) $2500 ( $2500, $3000) $3500 ( $3500, $4000) $3000 ( $3000, $3500) $3000 ( $3000, $3500)
90% $4000 ( $4000, $4500) $4000 ( $4000, $4500) $4000 ( $4000, $4800) $4000 ( $4000, $4500) $4000 ( $4000, $4500) $6000 ( $6000, $7000) $5000 ( $5000, $6000) $5000 ( $5000, $6000)
99% $10000 ( $10000, $13200) $10000 ( $10000, $15000) $12000 ( $11000, $15000) $10000 ( $10000, $13000) $10700 ( $10000, $14000) $18000 ( $15000, $20000) $15000 ( $15000, $20000) $15000 ( $15000, $20000)

5.6.2 Spending in Nevada

2015 2016 2017 2018 2019 2022 2023 2024
Average fuel spending $90.8 (87.7, 93.9) $79.5 (76.4, 82.6) $78.6 (75.8, 81.4) $89.8 (86.6, 93.0) $94.6 (90.8, 98.4) $191.0 (185.4, 196.7) $174.3 (168.6, 180.1) $164.2 (156.6, 172.0)
Average food spending $102.3 (98.9, 105.8) $104.2 (99.8, 108.8) $106.6 (101.9, 111.3) $107.4 (103.5, 111.3) $114.3 (110.0, 118.7) $172.4 (166.5, 178.3) $165.3 (158.6, 172.2) $160.6 (151.5, 170.0)
Average lodging spending $40.0 (37.2, 42.9) $45.2 (41.3, 49.3) $49.1 (45.2, 53.1) $47.2 (43.5, 51.0) $60.6 (56.0, 65.5) $178.1 (167.4, 189.1) $161.8 (149.9, 174.1) $150.6 (134.4, 167.8)
Average survival spending $35.1 (33.0, 37.3) $36.8 (33.9, 39.8) $38.9 (36.1, 41.8) $36.7 (34.0, 39.5) $37.6 (34.8, 40.4) $137.7 (128.8, 146.9) $118.7 (109.9, 127.8) $127.4 (114.7, 140.8)
Average fun spending $37.6 (35.0, 40.2) $35.3 (32.5, 38.3) $39.3 (36.3, 42.5) $38.1 (35.2, 41.2) $39.7 (36.8, 42.7) $137.7 (128.7, 146.9) $121.4 (113.1, 129.9) $132.4 (118.9, 146.6)